Figures & data
Figure 1. Flow chart of the study.
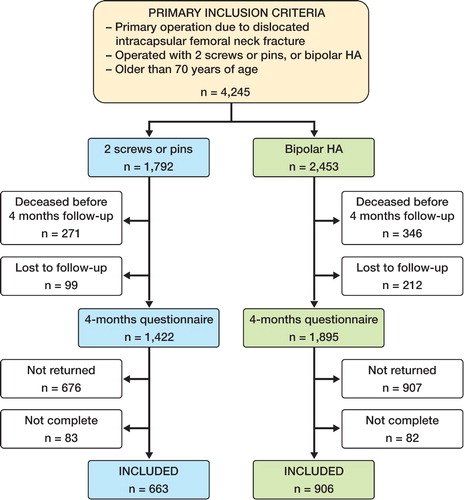
Table 1. Baseline characteristics of patients
Table 2. Types of implants
Table 3. Pain and satisfaction with the result of the operation, derived 4 months postoperatively from visual analog scales (VAS)
Figure 2. The degree of pain derived from a visual analog scale (VAS) 4 months postoperatively. The figure shows the distribution of pain for the 2 different treatment groups. 0 indicates no pain and 100 indicates unbearable pain.
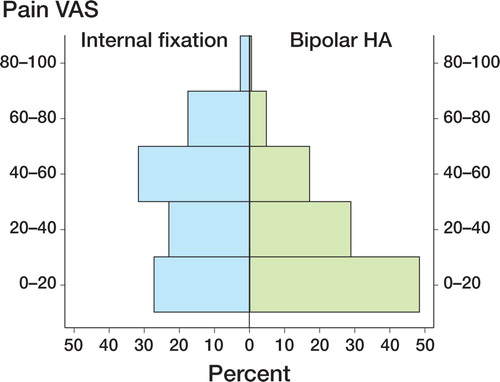
Figure 3. The degree of satisfaction with the result of the operation, derived from a visual analog scale (VAS) 4 months postoperatively. The figure shows the distribution of patient satisfaction for the 2 different treatment groups. 0 indicates very satisfied and 100 indicates very dissatisfied.
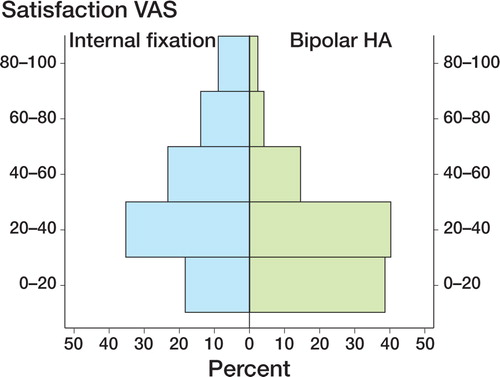
Figure 4. Health-related quality of life (EQ-5D index score) for patients at 0 and 4 months. 0 indicates the worst possible health state and 1.0 indicates full health. The p-values are given for differences between the treatment groups (general linear model).
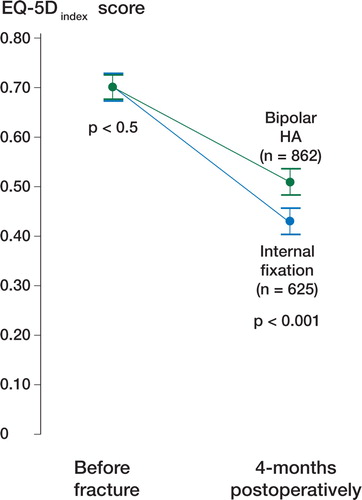
Table 4. Quality of life (EQ-5D) for patients operated with internal fixation or bipolar hemiarthroplasty