Figures & data
Figure 1. The 4-point bending device. The force (F) was applied with a cross-head speed of 1 mm/min. The applied load (F) and the vertical displacement (d) were recorded online by the Instron machine. The angular displacement was calculated by dividing the cotangent of the vertical displacement (d) by the length of the lever arm (x = 43 mm). The bending moment was calculated by multiplying half of the applied load by the length of the lever arm.
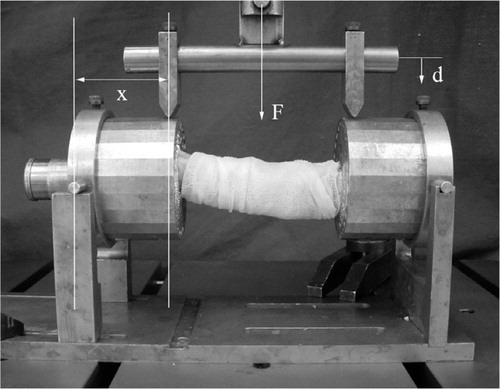
Figure 2. Schematic drawing of the torsion device. Both ends of the specimen (Sp) were placed in cylindrical cups, and the axes of the bones were centered. The proximal part was allowed to rotate in a suspension system, and the distal part was rigidly fixed. Via an arm of 100 mm, an increasing load (F) was applied perpendicular to the axis of the bones until failure. The angle rotation was set at 5 degrees/min. During the test, the vertical displacement (d) and the applied load were recorded. The angular displacement was calculated by dividing the cotangent of the vertical displacement (d) by the length of the lever arm (100 mm).
Figure 3. Typical angular displacement vs. moment curve from a torsion test. There is a correlation between the slope of the regression line (R) and the stiffness of the bone. The area under the curve is a measure of the energy absorption. The highest point of the regression line represents the strength (St).
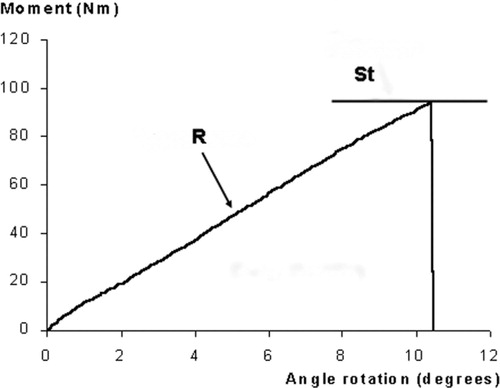
Figure 4. Results of the 4-point bending tests and torsion tests for the frozen group and the embalmed group. For both groups, the average slope of the regression line of the plot between the moment and angular displacement (N/degree) and the strength (Nm) are given. All values have been corrected for BMD. The post hoc test between the reference group and the different time groups did not show any significance. A: reference group; B: 1.5-month group; C: 3-month group; D: 6-month group; E: 12-month group.

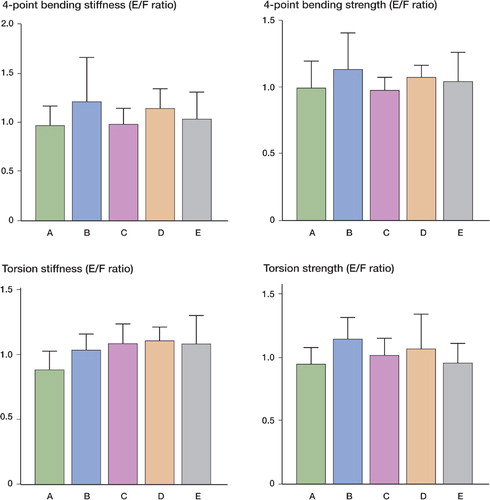
Figure 5. The ratios of the embalmed (E) and frozen (F) bones for both stiffness and strength in the 4-point bending and torsion tests. In the reference group, the ratio between values for left and right bones is shown. For both types of test, no significant differences were found between the embalmed and the frozen bones, or the left and right bones, in any of the groups. A: reference group; B: 1.5-month group; C: 3-month group; D: 6-month group; E: 12-month group.
Results for the 4-point bending and torsion tests. All results have been corrected for bone mineral density. Values in parenthesis are the 95% confidence intervals. Post hoc analysis did not reveal any significant differences between the reference group and other time groups, or between freezing and embalming
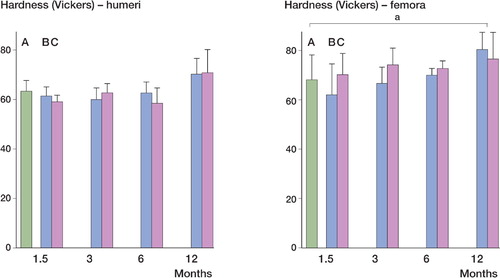
Figure 6. Hardness of the humeri and femora in the time groups. The femora of the 12-month frozen group were harder than in the reference group (a p = 0.007); no significant differences were seen for the embalmed bones (p = 0.06). No significant difference was found in any of the other groups in comparison with the reference group, although the 12-month frozen and 12-month embalmed groups for the humeri were almost statistically significantly harder (p = 0.07 and 0.07, respectively). A: reference group; B: frozen group; C: embalmed group.