Figures & data
Figure 1. Annual incidence rates for primary TKA (left panel) and revision TKA (right panel), with breakdown according to sex. 95% confidence intervals are shown.
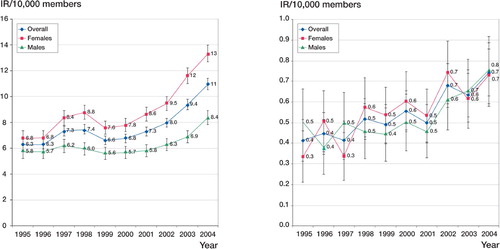
Figure 2. Number of primary TKA cases (left panel) and revision TKA cases (right panel) per year according to age.
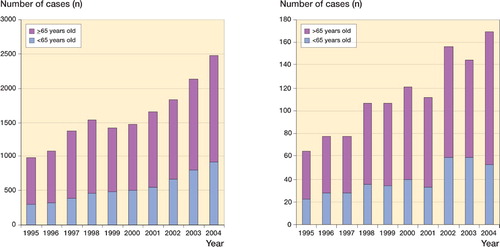
Figure 3. Projected number of primary TKAs.
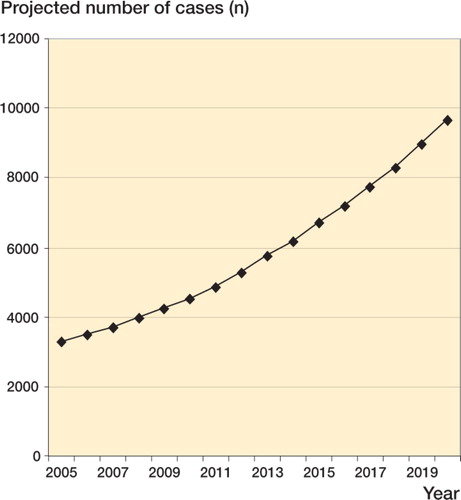
Table 1. Demographics
Table 2. Complications and re-admission rates