Figures & data
Figure 1. Fracture healing. Representative images of fracture healing at 8-week endpoint presented as digital radiography (left panels), μCT section (center panels), and histological section (Weigert’s hematoxylin, Alcian blue, and van Gieson) (right panels) of rats treated with placebo (upper row), bolus ZA (middle row), and ZA on a weekly basis (bottom row).
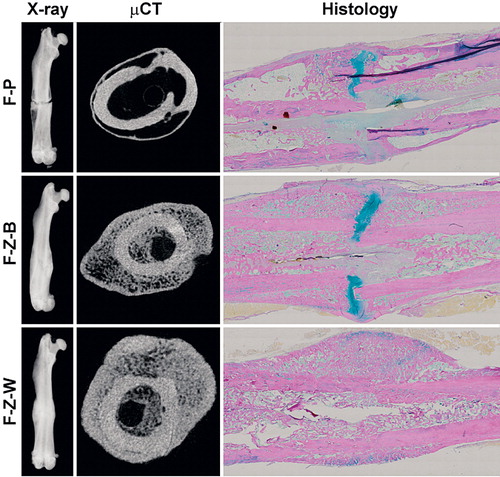
Figure 2. μCT-based quantification of fracture callus and corresponding bone segment in intact animals. A and B. At the 8-week endpoint of the study, quantification of the apparent callus formation in the fracture animals confirmed statistically significantly increased bone mineral content (BMC) (panel A) and bone volume (BV) (panel B) compared to the corresponding intact groups (Mann-Whitney U-test). Both bolus ZA treatment and weekly ZA treatment resulted in significantly higher BMC and larger callus volume than in the placebo-treated fracture group (Mann-Whitney U-test). C. Neither ZA treatment nor fracture had any statistically significant effect on BMD (Student’s t-test). Data are median, with box plot whiskers showing range (min to max). a p < 0.05, b p < 0.01.
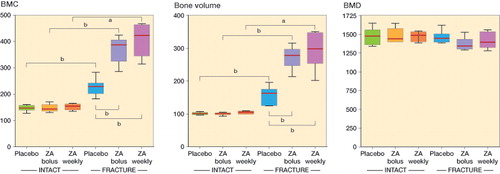
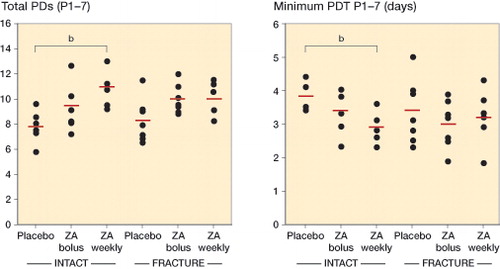
Figure 3. Proliferative capacity of rat MSCs. The long-term proliferative capacity was assessed as the total cumulative number of population doublings (total PDs) reached throughout passage 7 (P1–7) (panel A), while the proliferation rate was assessed as days per PD, and presented as minimum PD time in days recorded at a single passage (P1–7) (panel B). In the intact groups, MSCs from the animals treated with ZA on a weekly basis had a higher long-term proliferative capacity (p = 0.007) (A), and higher proliferation rate (p = 0.009) (B) compared to the corresponding placebo groups. All pairwise comparisons performed with Student’s t-test. Point graphs with mean value indication, b p < 0.01