
Figures & data
Figure 1. Distribution of lymphocytes and also the immunophenotype of inflammatory cells in a diffuse type (panel A) and perivascular type (B) of tissue response. The amounts of the different elements in the periprosthetic tissues, analyzed by using inductively coupled plasma optical emission spectrometry (ICPMS), are shown in panel C. Whiskers show standard error of the mean.
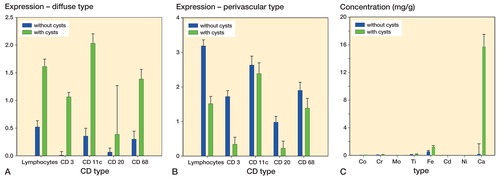
Figure 2. Histological slides retrieved from a patient without periarticular cystic cavities (ballooning osteolysis). Perivascular infiltration by lymphocytes can be seen.
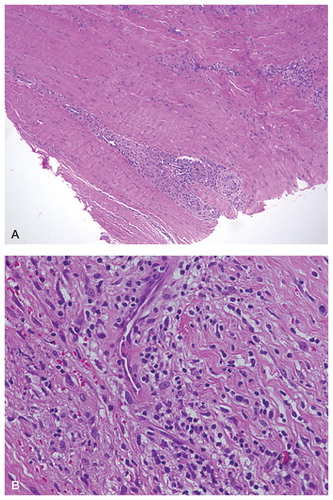
Figure 3. Example of calcium detection using von Kossa staining (with black showing calcium).
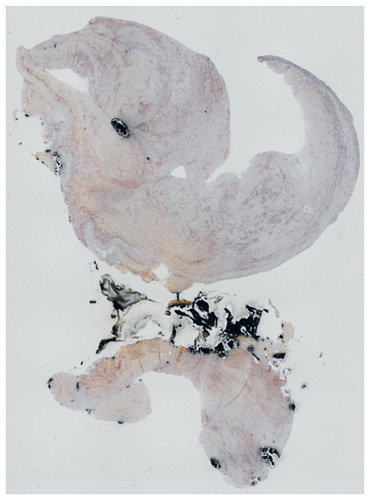
Table. De mographic and clinical data on patients