Figures & data
Figure 1. Flow diagram of the study.
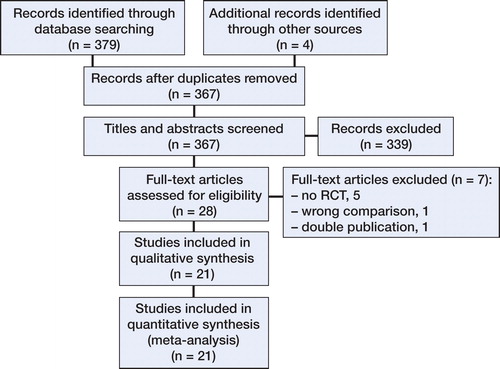
Table 1. Baseline characteristics of the studies included
Figure 2. Forest plot for hip-knee-ankle axis outliers per patient-specific system.
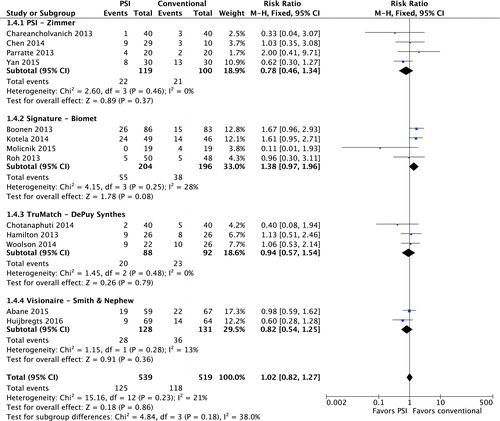
Figure 3. Forest plot for coronal tibial outliers
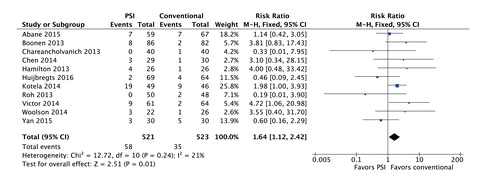
Figure 4. Forest plot for deviation from intended femoral rotation.
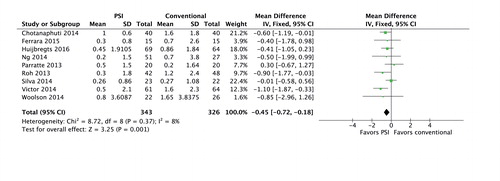
Figure 7. Risk-of-bias summary; “–” indicates high risk of bias, “?” indicates unclear risk, and “+” indicates low risk of bias.
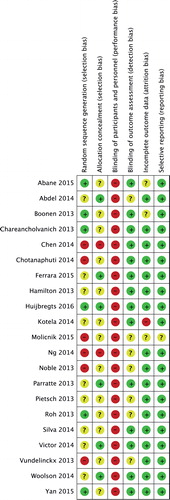
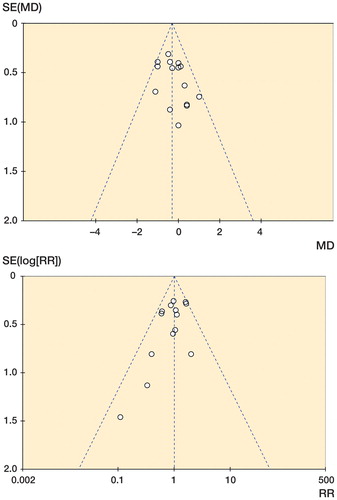
Figure 8. Funnel plots. A. Funnel plot of publication bias for deviation of intended hip-knee-ankle axis. B. Funnel plot of publication bias for hip-knee-ankle axis outliers.