
Figures & data
Table 1. Flow chart of the patients
Figure 1. Maximum subsidence of the tibial component in the 2 groups with postoperative and 3-month examinations as reference. Mean with 95% CI (whiskers).
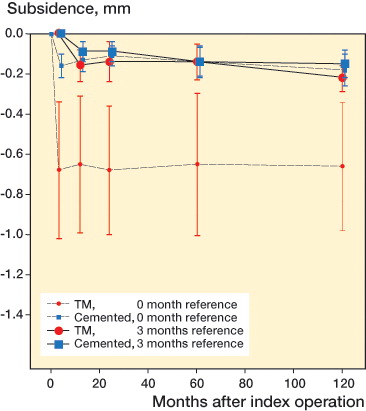
Figure 2. Maximum total point motion (MTPM) of the tibial component in the 2 groups, with postoperative and 3-month examinations as reference. Mean with 95% CI (whiskers).
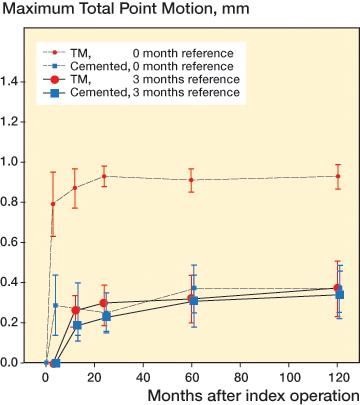
Table 2. Migration at 10 years with postoperative examination as reference. In patients who were operated bilaterally, only the first-operated knee was included
Table 4. Migration at 10 years with 3-month examination as reference. In patients who were operated bilaterally, only the first-operated knee was included
Table 5. Median differences and 95% CI for migration at 10 years between trabecular metal (TM) and NexGen cemented (NG) tibial components with 3-month examination as reference. In patients who were operated bilaterally, only the first-operated knee was included