
Figures & data
Table 1. Number and proportion of study implants, and demographic data
Table 3. Number and proportion of Exeter-subgroup devices, and demographic data
Figure 1. •••
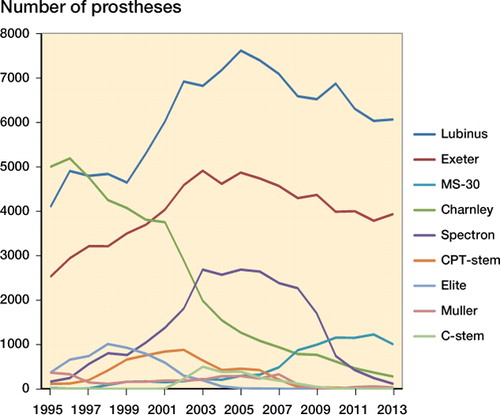
Table 4. Kaplan-Meier survivorship of the study devices at 10 and 15 years with revision for any reason as the endpoint, and adjusted revision rate (RR) (age, sex, diagnosis, femoral head material) for revision using Cox regression
Figure 2. •••
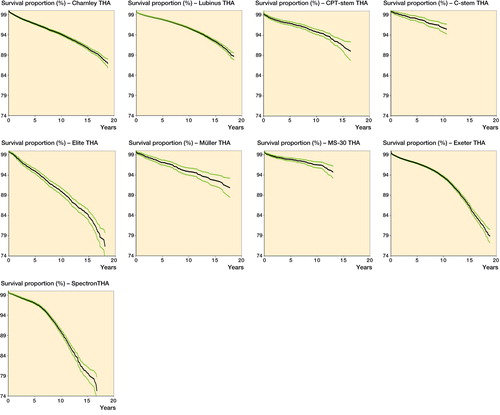
Figure 3. •••
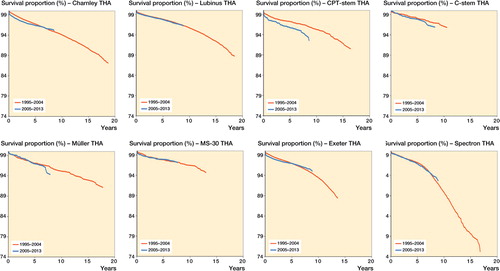
Table 5. Implant survival at 7 years for the time periods 1995–2004 and 2005–2013, with any reason for revision as the endpoint
Table 6. Kaplan-Meier survivorship of the study devices with either Palacos-type, Simplex-type, or other bone cement at 10 years with aseptic loosening as the endpoint
Table 7. Adjusted revision risk (age, sex, diagnosis, femoral head material) for revision of the Exeter-subgroup devices