
Figures & data
Figure 1. Flow chart of the recruitment.
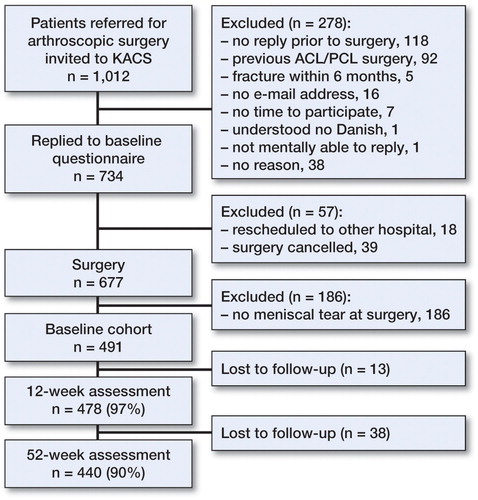
Table 1. Baseline patient characteristics. Values are number (percentage) unless otherwise stated
Figure 2. Patients’ expectations regarding time to recovery after meniscal surgery, with breakdown into 3 age groups. Bars show proportions and whiskers represent 95% CI.
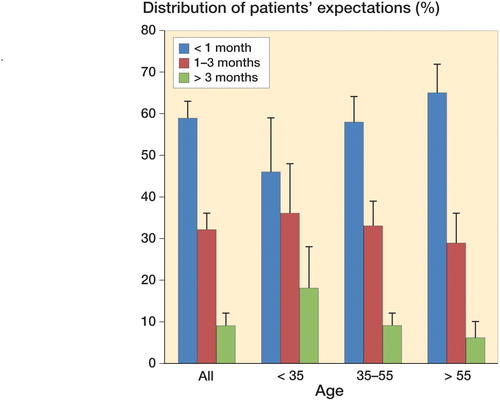
Figure 3. Distribution of preoperative expectations and actual outcome at follow-up. Bars show proportions and whiskers represent 95% CI.
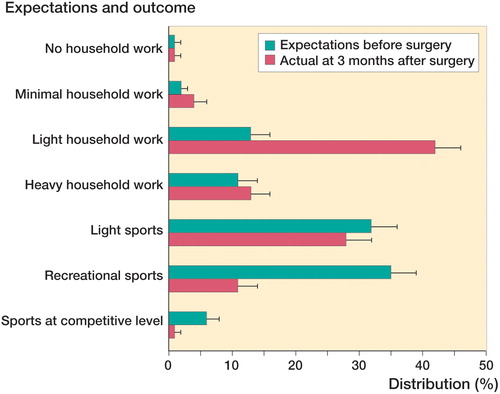
Table 2. Patients’ KOOS scores at 3-month follow-up, according to satisfaction (yes/no) and expectations (high/low). Values are mean postoperative scores (SD)