
Figures & data
Table 1. Baseline demographic information on the study population of 143,217 individuals (arthroplasty cases and controls)
Table 2. Crude survival for different time intervals with 95% confidence intervals, for controls and THA patients
Table 4. Crude and adjusted risk of 90-day mortality with 95% confidence intervals. The adjusted hazard ratio (HR) for each variable was derived from a model adjusting for the other variables included in the model (i.e. gender, age, Charlson comorbidity index (CCI), personal income, and education). By definition, reference groups had an HR of 1
Figure 2. Unadjusted first-year survival functions of THA patients and controls. A. Females aged 70–79, CCI =0. B. Males aged 80–89, CCI =3 or more. 95% confi dence intervals are shaded, but they may appear so narrow as to be indistinguishable. Numbers at risk: A: 5,268 THA patients and 33,025 controls; B: 230 THA patients and 542 controls.
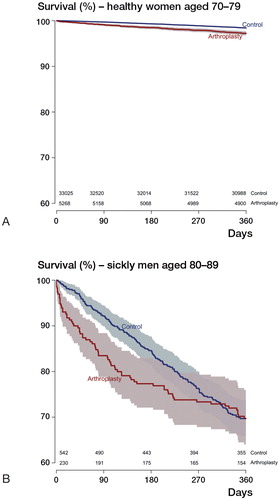
Table 5. Crude and adjusted risk of 90-day mortality with 95% confidence intervals in the subgroup of arthroplasty patients for whom information on ASA grade was available. The adjusted hazard ratio (HR) for each variable was derived from a model adjusting for the other variables included in the model (i.e. gender, age, Charlson comorbidity index (CCI), personal income, and education). By definition, reference groups had an HR of 1