
Figures & data
Figure 1. RM cementless press-fit socket (Mathys AG, Bettlach, Switzerland).
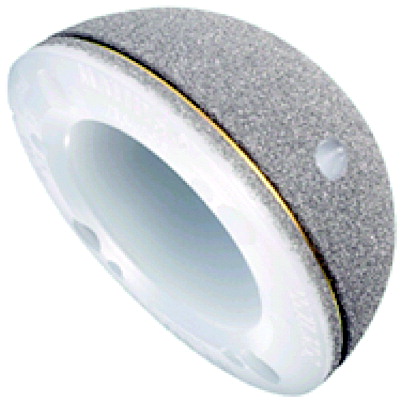
Figure 2. A. Scanogram. B. Sequential CT slices surrounding the acetabular component. C. measurement of cancellous BMD. In total, 6 axial scans were performed starting 10 mm above the socket, parallel to the horizontal teardrop line.
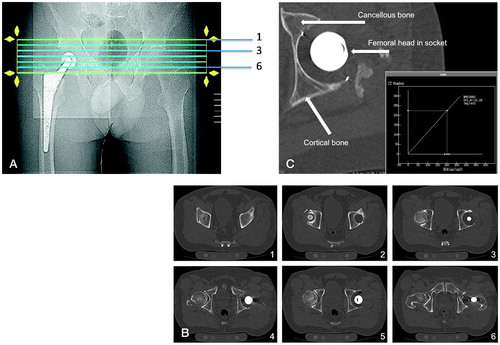
Table 1. Study demographics
Figure 3. Box plots of the cancellous bone mineral density in the 6 slices for the baseline, 6-month, and 24-month follow-up measurements. Blue bars indicate the BMD in the prosthetic hip; red bars indicate the BMD in the contralateral hip. The median is indicated by the central circle, thick lines are interquartile range, and the thin lines are total range excluding outliers, which are indicated by circles.
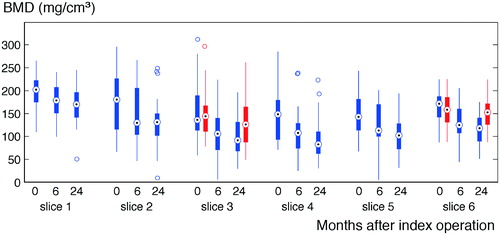
Table 2. Changes in BMD (%) relative to immediately postoperatively
Figure 4. Box plots of the cortical bone mineral density in the 6 slices for the baseline, 6-month, and 24-month follow-up measurements. Blue bars indicate the BMD on the prosthetic side and red bars indicate the BMD on the control side.
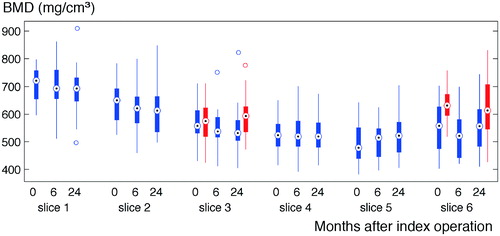
Table 3. Clinical scores. Values are median (range)