Figures & data
Table 1. Descriptive data regarding arthroplasty components
Figure 1. The 2 different instrument configurations used in this study: smooth tamp used for the compaction technique (left) and sharped rasp used for the broaching technique (right).
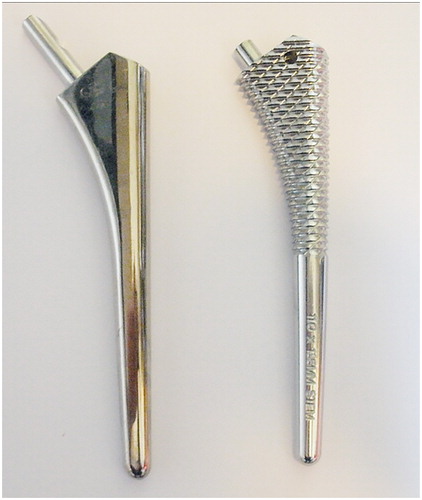
Table 2. Measurement of error for the RSA double-examination stereo radiographs (n = 14), for translations and rotations
Table 3. Signed migrations of the Bi-metric femoral stem as mean (95% CI) along and about the 3 orthogonal axes, measured with RSA at 6 weeks, 12 weeks, 1 year, 2 years, and 5 years after surgery
Table 4. Bone mineral density in the femoral Gruen zones, as mean (95% CI) percentage of baseline values at 1, 2, and 5 years
Figure 2. CONSORT flow diagram showing the inclusion/exclusion process and follow-up until 5 years.
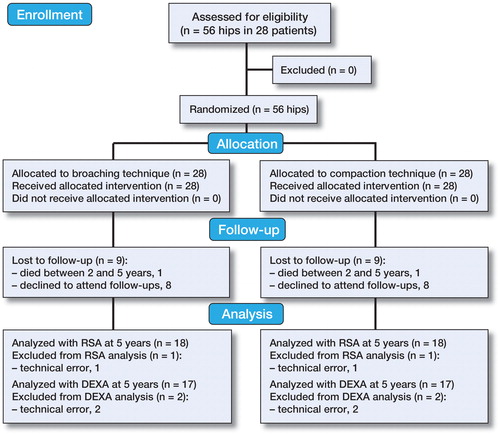
Figure 3. Medio-lateral migration (in mm) illustrated as a pairwise comparison of broaching and compaction at 6 weeks, 12 weeks, 1 year, 2 years, and 5 years after surgery.
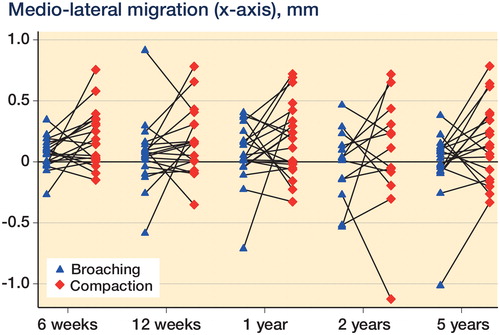
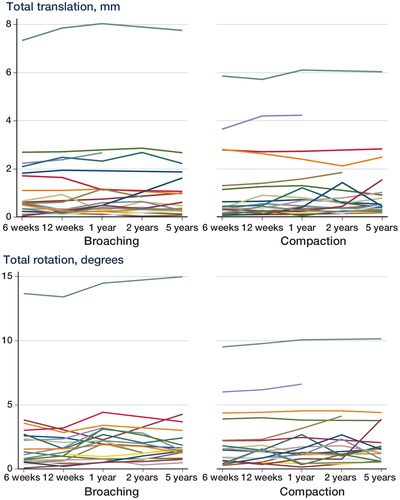
Figure 4. Total rotations and total translations measured at 6 weeks, 12 weeks, 1 year, 2 years, and 5 years.