
Figures & data
Table 1. Demographic data for cemented and reverse hybrid THAs. Comparison of survival (in %) and relative risk (RR) of revision, with all revisions as endpoint for the total material
Figure 1. Flow chart of the study.
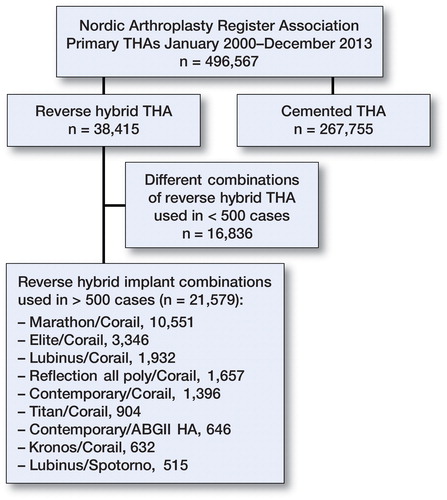
Figure 2. Cox survival analysis with adjustment for age, sex, time period, and diagnosis, and with any revision of the implant as endpoint. RR =1.4 (CI: 1.3–1.5; p < 0.001).
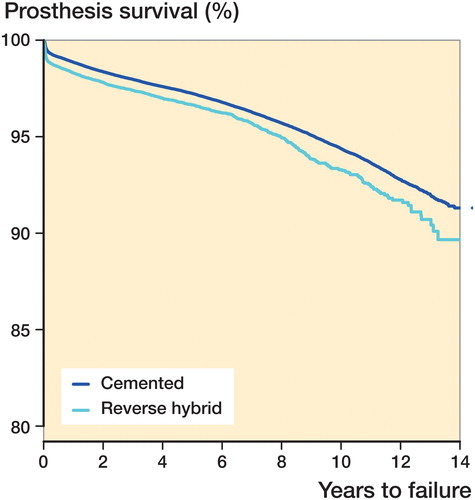
Figure 3. Revisions in the first 12 months after surgery. Cox survival analysis with adjustment for sex, diagnosis, and period.
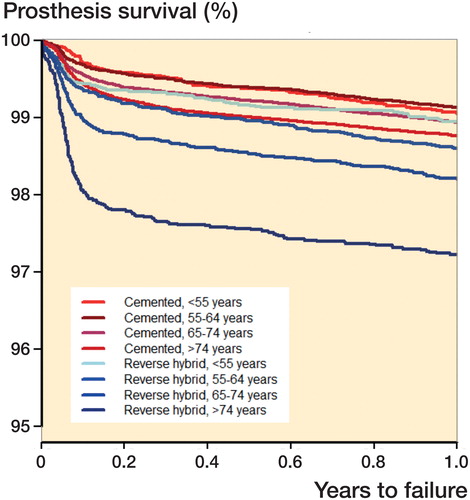
Table 2. Comparison of reverse hybrid THAs and cemented THAs in corresponding age groups regarding risk of revision. Cemented THAs were defined as 1 when calculating RR. Cox analysis was used, with adjustment for gender, primary diagnosis, and period
Table 3. Relative risk of revision due to fracture in men and women
Figure 4. Prosthesis survival with revision of either cup or stem for any reason, and with adjustment for sex, age, diagnosis, and period.
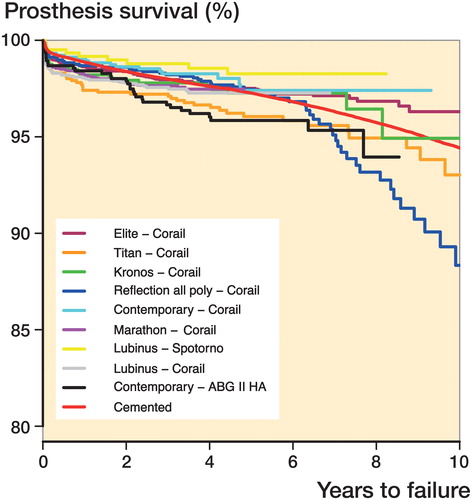
Table 4. Cox regression results for reverse hybrid brand combinations compared to cemented THAs, with adjustment for age, sex, period, and diagnosis. The endpoint was any revision. Median follow-up was calculated by "reverse Kaplan-Meier"
Table 5. Cox regression results for reverse hybrid brand combinations compared to cemented THAs concerning early revision (< 1 year), with adjustment for age, sex, period, and diagnosis
Table 6. Cox regression results for reverse hybrid brand combinations compared to cemented THAs with follow-up of more than 5 years, and with adjustment for age, sex, and diagnosis