
Figures & data
Table 1. Clinical and laboratory findings
Figure 1. Comparison of cobalt ion levels (left panel) and chromium ion levels (right panel), in ppb. The bottom, middle, and top horizontal lines of the boxes represent the first quartile, the median, and the third quartile. The ends of the whiskers correspond to the limits of the data, beyond which any values are considered anomalous. Dots show the outler levels measured. The horizontal line corresponds to 5 ppb.
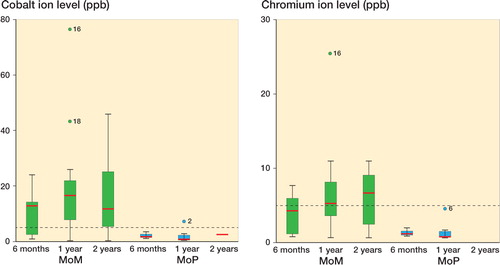
Figure 2. Changes in mean serum cobalt levels (left) and mean serum chromium levels (right)in ppb at different time points, with 95% confidence intervals measured by repeated-measures ANOVA.
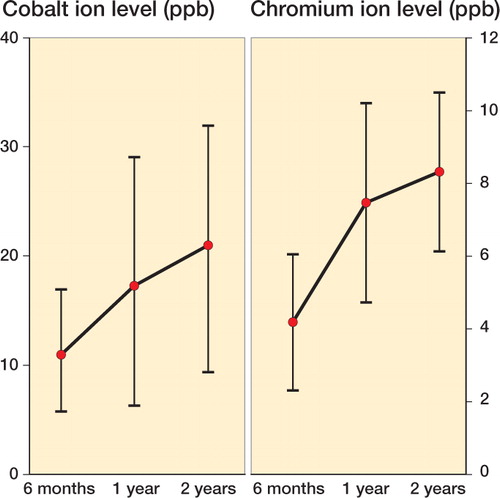
Figure 3. Images from a 25-year-old man who had undergone distal femoral replacement 1 year earlier due to a primary bone tumor. He had a swelling in the region of the operated knee. Axial view showed a thin-walled cystic pseudotumor with liquid-like low signal intensity (left panel). Aspirations were repeatedly negative for bacterial growth and showed the typical appearance of metal reaction (right panel).
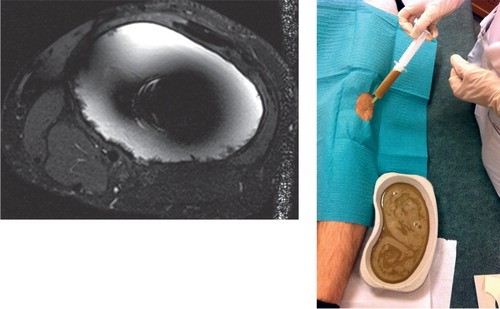
Figure 4. A 72-year-old man had a revision arthroplasty with hinge MoM after multiple failed knee arthroplasty revisions. After 3 years, he developed a massive soft tissue expansion around the distal femur. During revision arthroplasty, a thick-walled pseudotumor with solid components was encountered.
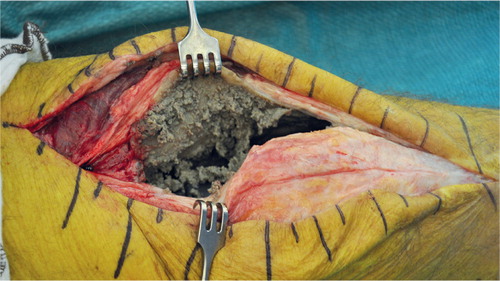
Table 2. Revisions due to adverse reaction to metal debris