Figures & data
Table 2. Patient characteristics
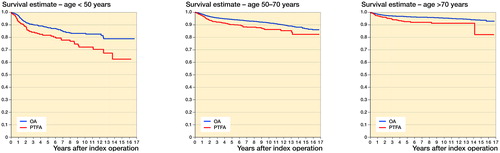
Figure 1. Survival estimation by Kaplan-Meier method for TKA inserted due to PTFA (red line) and due to primary OA (blue line).
A. Patients younger than 50 years. A significant difference was found by log-rank test (p = 0.001). The estimated survival in the PTFA group at 1, 5, and 10 years following primary operation was 0.93 (CI: 0.88–0.95), 0.82 (CI: 0.76–0.86), and 0.72 (CI: 0.64–0.79), respectively. Similarly, the corresponding survival rates in the OA group were 0.97 (CI: 0.96–0.98), 0.88 (CI: 0.86–0.89), and 0.83 (CI: 0.80–0.86).
B. Patients aged between 50 and 70 years. A significant difference was found by log-rank test (p < 0.001). The estimated survival at 1, 5, and 10 years following primary operation in the PTFA group was 0.97 (CI: 0.96–0.98), 0.90 (CI: 0.87–0.92), and 0.86 (CI: 0.83–0.89). Similarly, the 1-, 5-, and 10-year survival in the OA group was 0.98 (CI: 0.98–0.99), 0.94 (CI: 0.94–0.95), and 0.91 (CI: 0.91–0.92).
C. Patients aged more than 70 years. A significant difference was found by log-rank test (p < 0.001). The estimated survival at 1, 5, and 10 years following primary operation in the PTFA group was 0.97 (CI: 0.95–0.99), 0.93 (CI: 0.89–0.95), and 0.91 (CI: 0.87–0.94). Similarly, the 1-, 5-, and 10-year survival in the OA group was 0.99 (CI: 0.98–0.99), 0.97 (CI: 0.96–0.97), and 0.95 (CI: 0.95–0.96).