Figures & data
Table 1. Clinical characteristics of 69 patients who underwent surgery for metastatic spinal cord compression as the initial manifestation of malignancy. Values are median (range) or absolute numbers of patients
Table 2. Anatomical location of spinal cord compression confirmed by MRI. Data are numbers of patients
Table 3. Frankel classification of neurological functionTable Footnotea. Data are numbers of patients
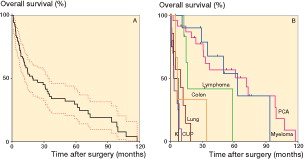
Figure 2. Survival after surgery. A. All patients (n = 69); error bars show 95% CI. B. According to the tumor type. K: kidney cancer (n = 4); CUP: cancer of unknown primary tumor (n = 10); lung cancer (n = 7); colon cancer (n = 3); lymphoma (n = 6); myeloma (n = 11); and PCA: prostate cancer (n = 24). Other tumors not included in the graph: breast cancer (n = 1), thyroid cancer (n = 1), sarcoma (n = 1), and epithelioid mesothelioma (n = 1).