Figures & data
Figure 1. Total number of non-unions treated over a 5-year period in Scotland.
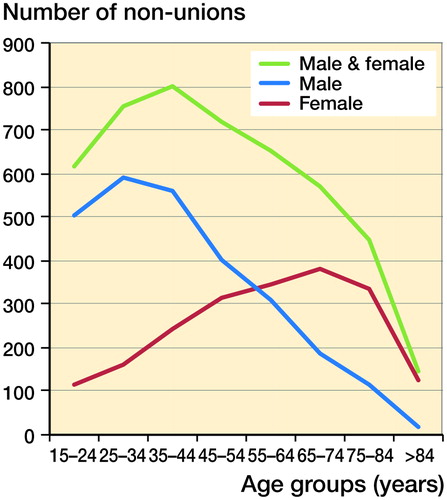
Table 1. Total numbers of non-union patients in Scotland over 5 years between 2005 and 2010 according to age and ISD-10 anatomical non-union site
Figure 2. Incidence of fractures per 100,000 population, according to sex.
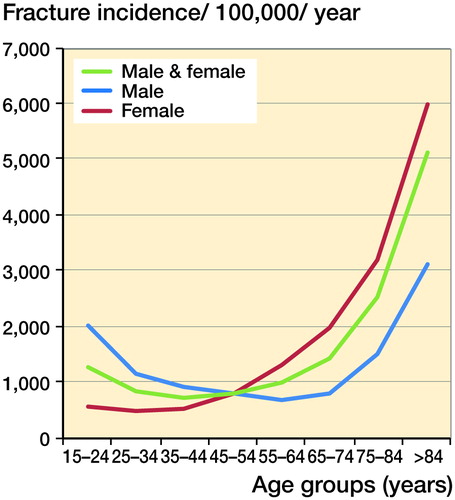
Figure 3. Incidence of fractures per 100, 000 population, according to ISD-10 anatomical distribution.
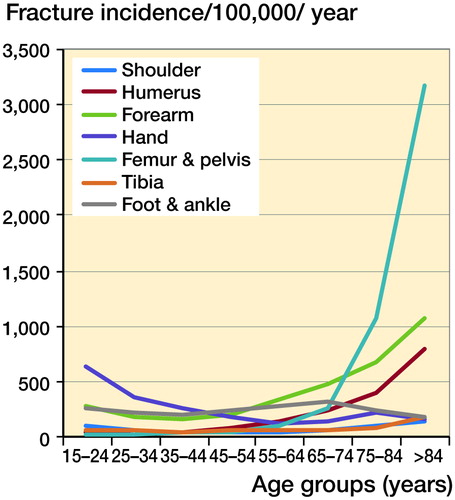
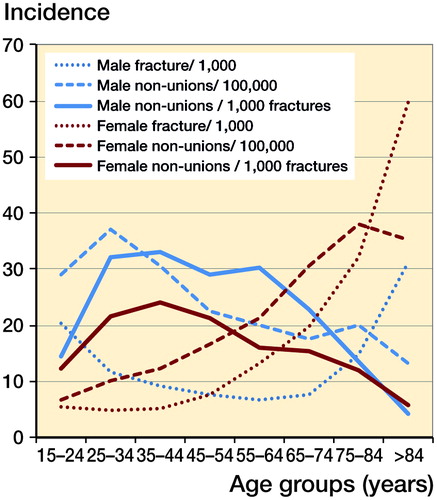
Figure 4. Incidence of non-union per 1,000 fractures per annum, according to sex.
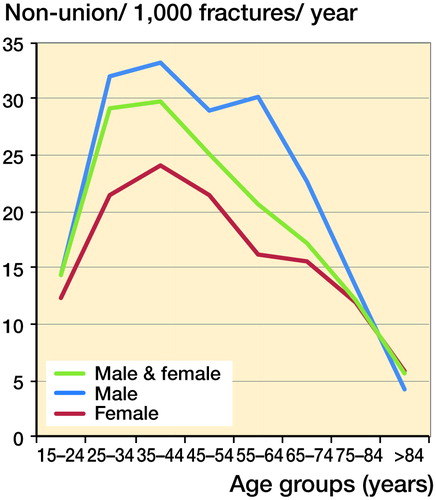
Figure 5. Incidence of non-union per 1,000 fractures, according to ISD-10 anatomical distribution.
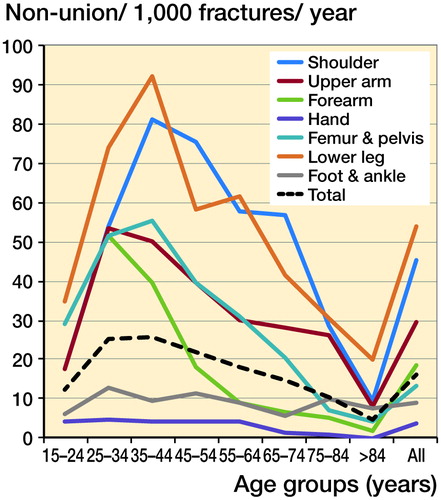
Table 2. Frequency of non-union per 1,000 fractures, according to distribution of age and sex
Figure 6. Upper and lower estimates of clavicle non-union per fracture.
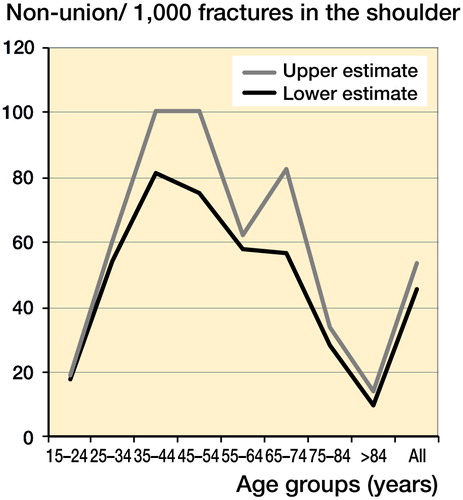
Figure 7. Incidence of non-union per 1,000 fractures, by age distribution, showing 95% confidence intervals.
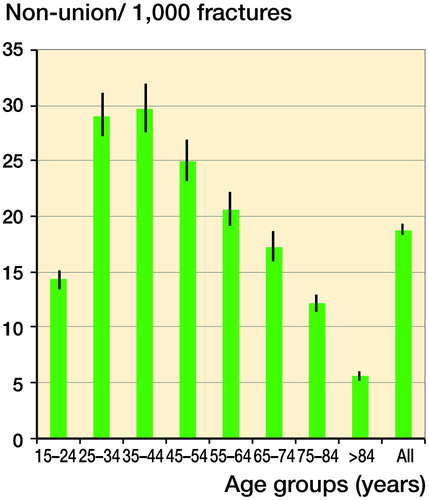
Figure 8. Incidence of non-union per 1,000 fractures, according to anatomical distribution, showing 95% confidence intervals.
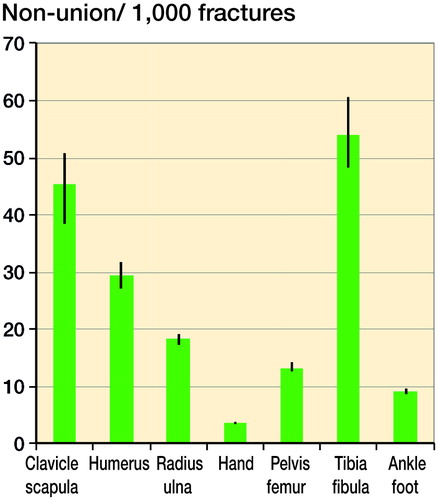
Figure 9. Comparison of the patterns of incidence of fractures, non-union, and non-union per fracture, according to age and sex.