
Figures & data
Figure 1. 2 images from the dataset. The area within the red box is the section presented to the network in order to classify the image. The left image is of a wrist fracture while the right image is without any apparent fracture.
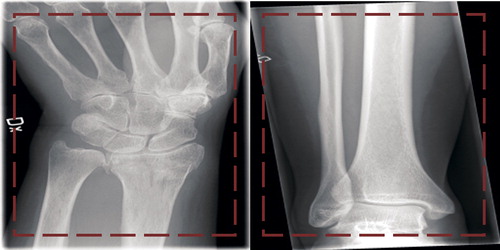
Table 1. Raw image and label data for a total of 256,458 images. 70% were reserved for training, 20% for validation, and 10% for testing
Figure 2. Performance of the 5 networks. An epoch is 1 pass over all images.
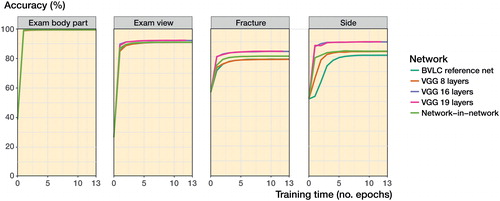
Table 2. Observer fracture outcome compared with gold standard
Table 3. Outcomes compared between observers. Accuracy is the percentage of outcomes where both observers agree, presented with Cohen’s kappa
Table 4. Manual review of classifications where the network failed
Supplemental material