
Figures & data
Figure 1. Flow chart of included procedures.
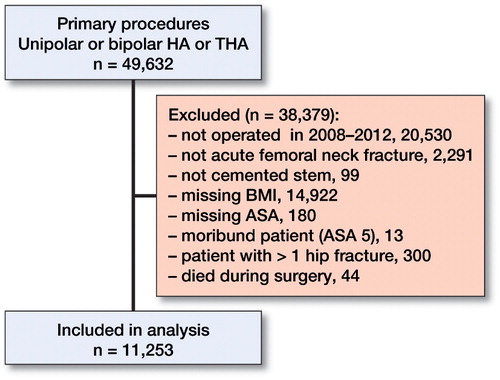
Table 1. Patient demographics and outcome
Figure 2. Kaplan–Meier survival curve (95% CI) with revision as end-point.
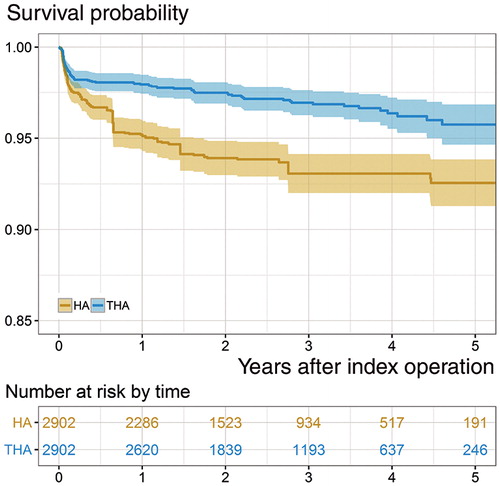
Figure 3. Kaplan–Meier survival curve (95% CI) with reoperation as end-point.
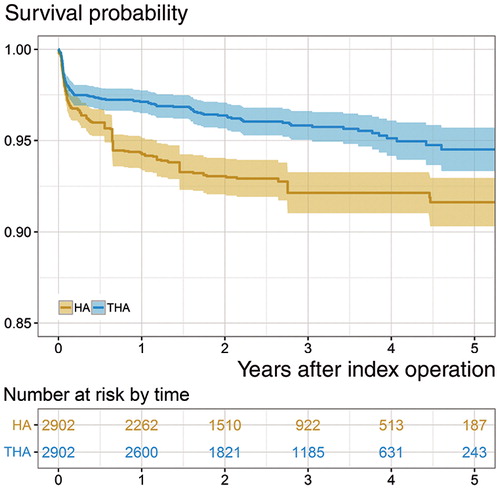
Figure 4. Kaplan–Meier survival curve (95% CI) with death as end-point.
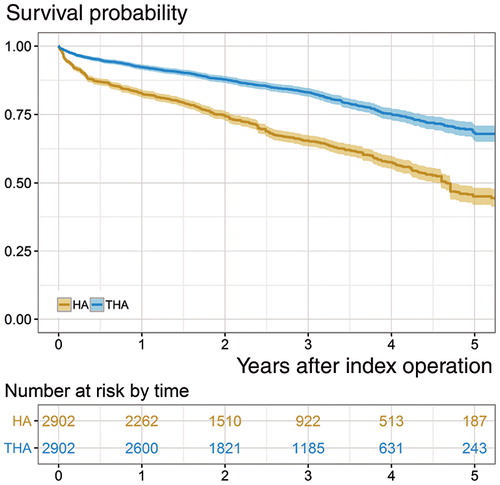
Table 2. Risk of revision and reoperation with death as competing risk, unmatched patients. Absolute risk reduction (95% CI)
Table 3. Risk of revision and reoperation with death as competing risk, matched patients. Absolute risk reduction (95% CI)