
Figures & data
Table 2. Patients participating in the 5-year follow-up
Figure 1. Flowchart of patients from inclusion to 5-year follow-up according to Consort statement.
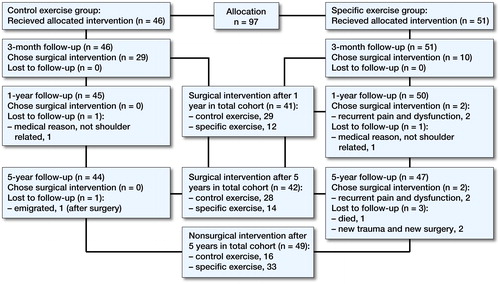
Figure 2. Mean Constant-Murley score values at the previous 3-month and 1-year follow-up and in addition the 5-year follow-up in the 4 groups of patients; specific non-operated, control non-operated, specific operated and control operated. These groups were created after the choice of surgery or not at the 3-month assessment.
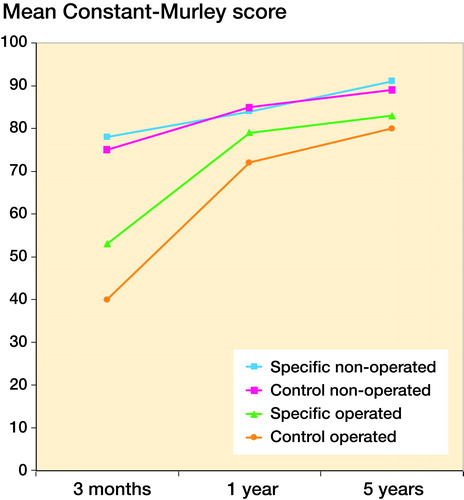
Figure 3. Mean Disability of the Arm, Shoulder and Hand score values at 3-month, 1-year and 5-year follow-up in the 4 groups of patients; specific non-operated, control non-operated, specific operated and control operated. These groups were created after the choice of surgery or not at the 3-month assessment.
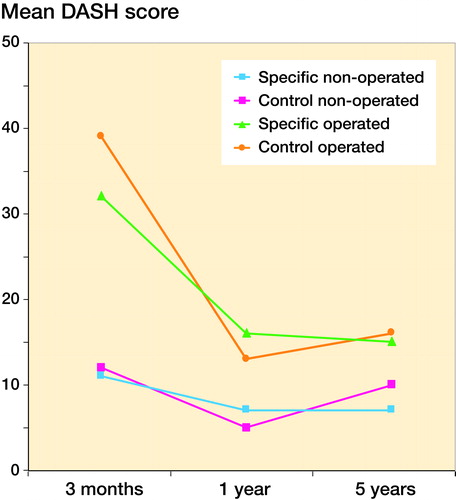
Table 5. Rotator cuff status, assessed with ultrasound. Findings from baseline in the original RCT and from the 5-year follow-up divided into those treated with surgery and those without surgery up until the 5-year follow-up
Table 4. Mean Constant-Murley score (C-M) and standard deviation (SD) in operated (n = 42) and non-operated (n = 48) patients at 3-month, 1-year and 5-year follow-ups for the 90 patients with 5-year C–M score