Figures & data
Table 1. Potential preoperative risk factors for failure of soft-tissue releases in 37 children, estimated as relative risks (RR) for failure, using Poisson loglinear regression
Figure 1. A. Preoperative radiograph of a 5 year 5-months-old boy with spastic quadriplegia (GMFCS level V), showing bilateral hip subluxation with migration percentage (MP) 40% (right hip) and 48% (left hip). B. 1.8 years after soft-tissue releases, showing good primary correction; MP of the left hip was reduced from 48% to 32%. C. 6.7 years postoperatively, showing good outcome with MP 15% (right hip) and 25% (left hip).
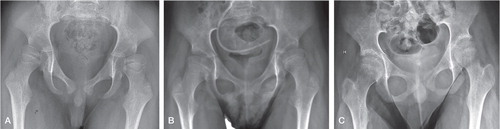
Figure 2. A.Preoperative radiograph of a 5 year 5 months old girl with spastic quadriplegia (GMFCS level V), showing subluxation of her left hip with migration percentage (MP) 50%. B. 1 year after soft-tissue releases, showing unsatisfactory primary correction; MP was reduced from 50% to 43%. C. 4.4 years postoperatively, showing poor outcome with MP 54% of the left hip. D. 3.1 years after Dega-type pelvic osteotomy and varus femoral osteotomy of the left hip (MP 31%).
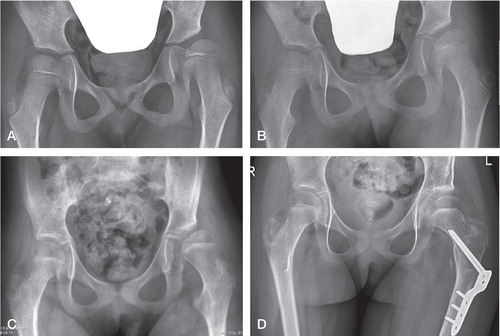
Table 2. Migration percentage (MP) pre- and postoperatively (mean MP of the worst hip in each patient) in 37 children and comparison between children with good and poor final radiographic results
Figure 3. Development of migration percentage (MP) according to functional levels (GMFCS) pre- and postoperatively.
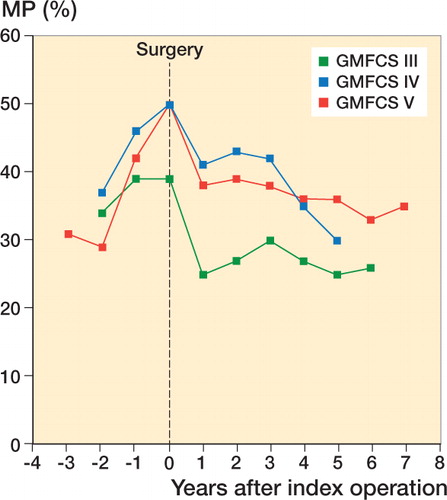
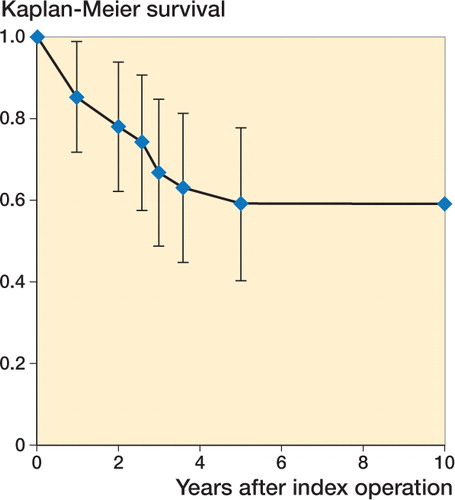
Figure 4. Kaplan–Meier survival plot (% survival with 95% confidence intervals) in nonambulatory children, with time to failure (reoperation or MP of the worst hip ≥50) as “survival”.