
Figures & data
Flowchart.
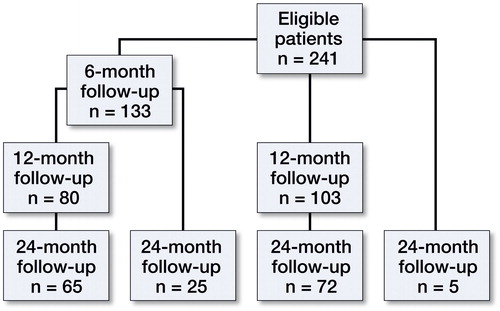
Table 1. Diagnosis, sex, and mean age of 241 patients
Table 2. Patient-reported outcome measure (PROM) scores. Values are mean (SD)
Table 3. Association between postoperative outcome and age, diagnosis, and prosthetic design
Table 4. Association between SF-36 and age, diagnosis, and prosthetic design
Table 5. Changes in patient-reported outcome (PROM) scores