Figures & data
Figure 1. Kaplan–Meier graph of 1-year (grey vertical line) and 5-year post-surgical survival of patients independent in basic mobility (CAS =6, blue line) and not (CAS <6, red line) on acute hospital discharge.
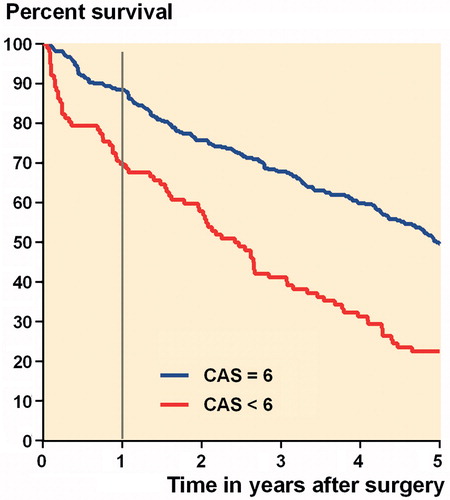
Table 1. Characteristics and 1-year mortality: values are mean (SD) for age and median (IQR) for the length of stay; otherwise, number (%)
Table 2. Multivariable Cox regression analysis of risk factors of mortality within 1 and 5 years after hip fracture surgery, n = 444
Figure 2. Distribution of CAS scores: 0 = cannot, 1 = can with assistance/guiding, and 2 = can independent of human assistance for each of the 3 CAS activities, at time of hospital discharge, for the 102 patients not reaching independence in the total CAS =6 points.
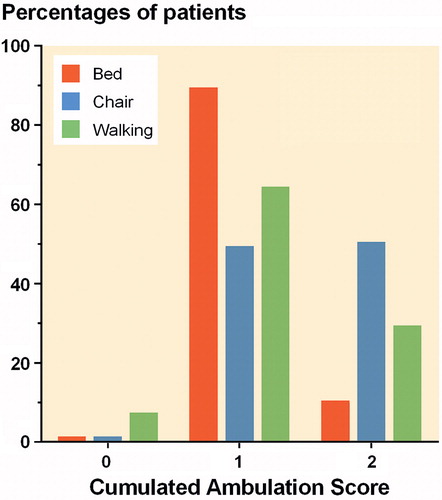
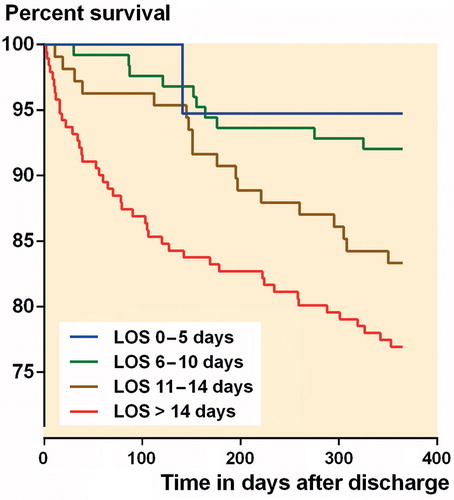
Figure 3. Kaplan–Meier graph of 1-year post-discharge survival of patients according to post-surgery length of hospital stay (LOS).