
Figures & data
Table 1. Study population
Figure 1. Description of the inclusion of the study population.
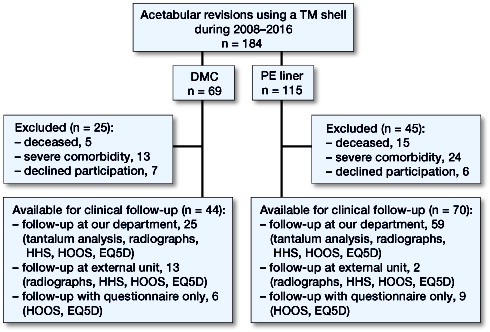
Figure 2. Kaplan–Meier survival curves with the endpoint dislocation with shaded area indicating CI (p = 0.01, derived from Mantel–Haenszel log-rank test). Numbers at risk for both subgroups are given above the X-axis.
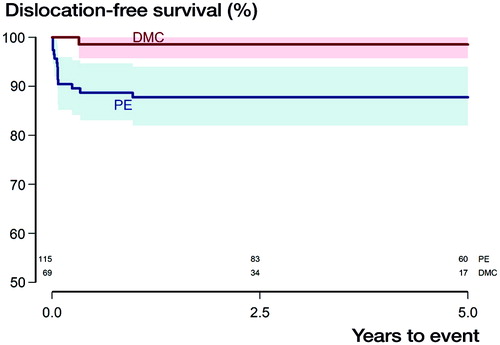
Figure 3. Kaplan–Meier survival curves with the endpoint re-revision for instability with shaded area indicating CI (p = 0.006, derived from Mantel–Haenszel log-rank test). Numbers at risk for both subgroups are given above the X-axis.
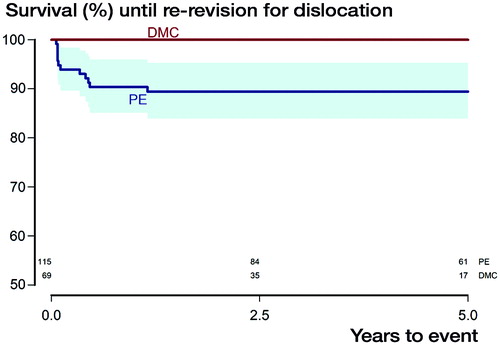
Figure 4. Kaplan–Meier survival curves with the endpoint re-revision for any reason with shaded area indicating CI (p = 0.03, derived from Mantel–Haenszel log-rank test). Numbers at risk for both subgroups are given above the X-axis.
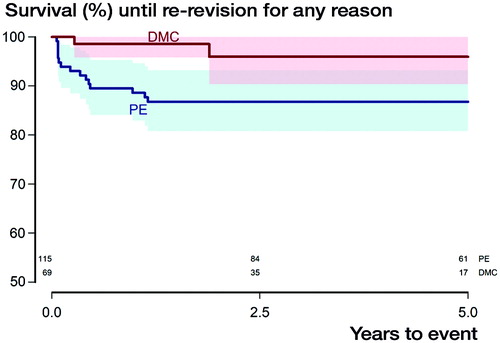
Table 2. Description of the re-revised study population
Table 3. EQ5D subdimensions
Table 4. HOOS subdimensions