
Figures & data
Figure 1. Medium power magnification (x10) light microscopy of a H&E stained histological section in a specimen from the 3 weeks ZA group from the middle of the bone tunnel showing (a) the superimposed circle of 1.6 mm and (b) the grid used to calculate the ratio of bone and tendon inside the tunnel. Scale bars =2 mm.
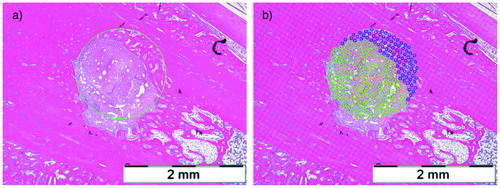
Figure 2. (a) High-power magnification (x40) light microscopy of section of the calcaneus from a specimen in the ZA group after 3 weeks subjected to TRAP enzyme histochemistry hematoxylin nuclear staining. Arrows indicate counted osteoclasts. (b) High-power magnification (x40) light microscopy of H&E stained section of the tendon–bone interface from a specimen in the control group after 6 weeks with bone resorption lacunae (arrows) in the tunnel wall containing osteoclasts. There is adjacent new woven bone (Wb) formation. Scale bars =500 µm.
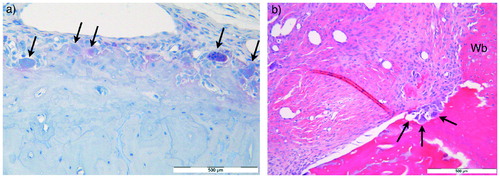
Figure 3. Upper panel: A specimen at baseline, showing the region of interest used for BMD and BMC measurements over the bone tunnel (a) and 3rd tail vertebra (b). Lower panel: X-rays of two 6-weeks specimens demonstrating bone formation around the bone tunnel in a specimen from the control group (c) and the ZA group (d). Radiographs were obtained from Lunar PIXImus.
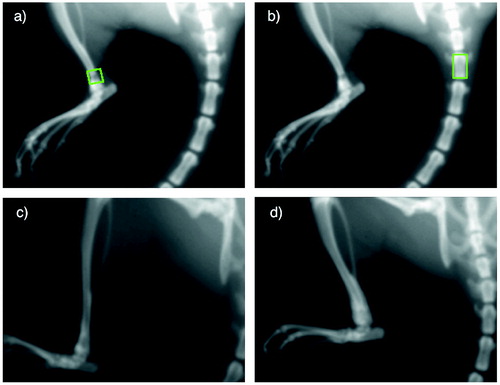
Figure 4. Clustered boxplots of data from mechanical testing of the tendon–bone interface. Except for elongation, all variables increased with time. There was a negative effect of ZA treatment in pullout strength and stiffness, but no significant differences in energy or elongation.
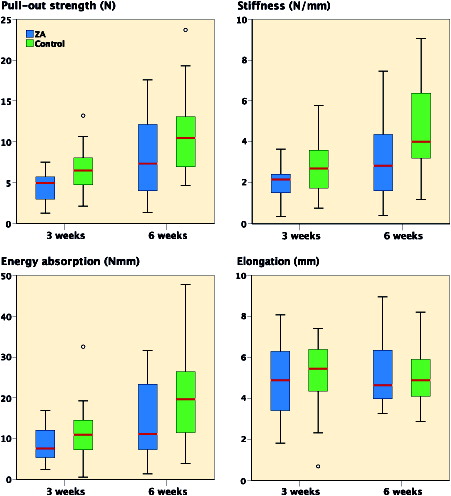
Figure 5. Clustered boxplots of data from DEXA measurements of the ROI over the bone tunnel: BMD and BMC difference from baseline.
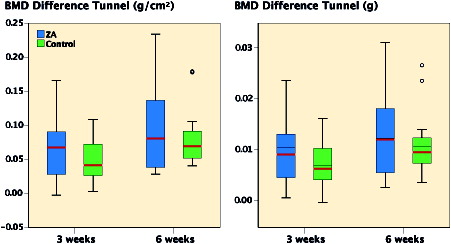
Figure 6. Low-power magnification (x4) light microscopy of H&E stained sections of distal leg showing anatomy and changes over time. The location of the bone tunnel (Tu) containing tendon graft was aimed 3 mm above the ankle joint in the transition between the tibia diaphysis (D) and metaphysis (M). The ankle joint (A) was visible in most sections. (a) 3-weeks ZA group: sharp tunnel edges. Callus/Wb. (b) 6-weeks control-group: Callus/Wb mature. The arrows point at large capillaries inside the tendon graft. Scale bars =2 mm.
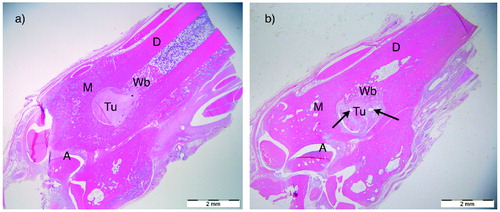
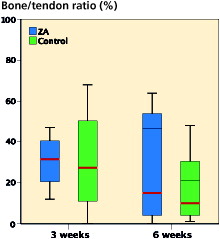
Figure 7. Clustered box-plots showing the bone–tendon ratio in the tunnel as measured by histomorphometry. No statistically significant effect of ZA treatment was observed at 3 weeks (p = 0.9, n = 8) or 6 weeks (p = 0.7, n = 9). Comparison of median values by independent samples Mann–Whitney test.
Total number of TRAP-positive osteoclast counts (median, range) in distal tibia containing the bone tunnel and the calcaneus of the ipsilateral leg. Comparison of median values by independent samples Mann–Whitney test. 1 outlier (a) of the 3-week controls was excluded from the above analyses due to a very high number of osteoclasts (> 200) in the calcaneus