Figures & data
Figure 1. Panel (a) is a line plot that illustrates the time at risk of 10 patients entering a study following arthroplasty (time 0) and exiting the study after failure where the only possible mechanism of exiting the study is failure, i.e., no other cause of censoring occurs. Panel (b) is a line plot that illustrates a non-informative mortality profile of the same 10 patients entering a study following arthroplasty (time 0).
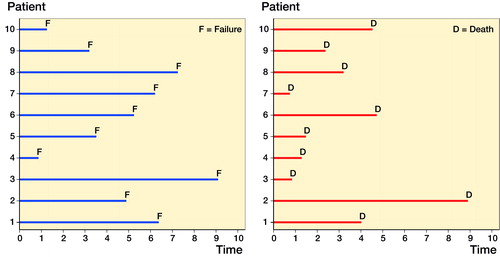
Figure 2. A line plot that illustrates the time at risk of 10 patients entering a study following arthroplasty (time 0) and the combination of a failure and mortality mechanism, i.e., mortal patients.
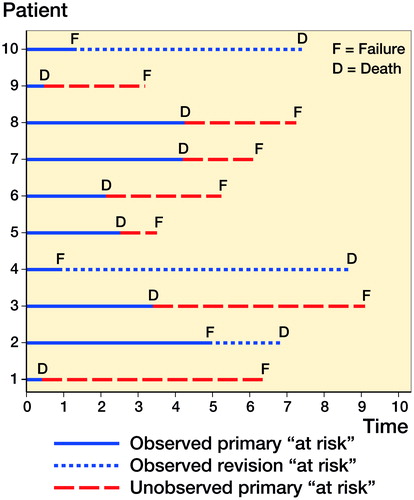
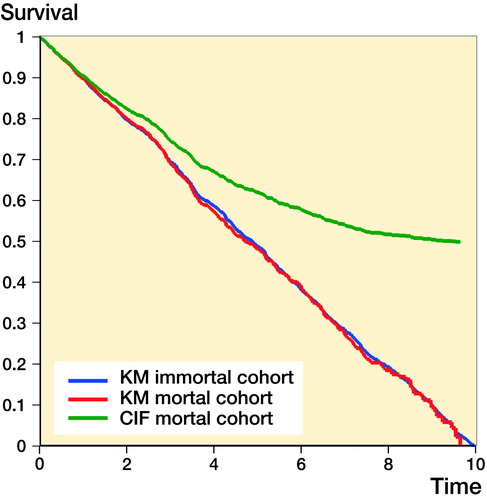
Figure 3. KM survival curves and the 1 minus the cumulative incidence function in mortal and immortal cohorts.