
Figures & data
Figure 1. Flowchart of included cases. 299 were reported to the registry, 285 were included in this study.
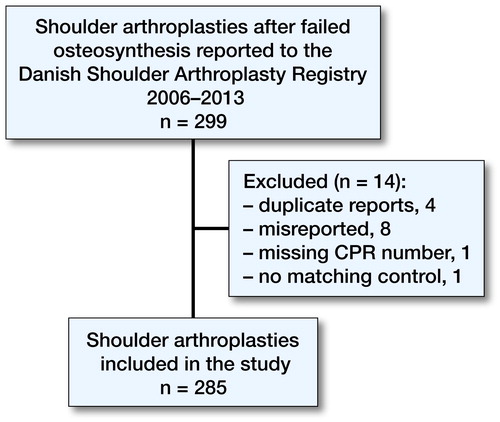
Table 1. Type of osteosynthesis in 285 cases
Table 2. Mode of osteosynthesis failure and outcome
Table 3. Causes of revision in cases (secondary arthroplasties) and controls (primary arthroplasties)
Figure 2. Implant survival functions of primary arthroplasty (green) and arthroplasty after failed osteosynthesis (blue).
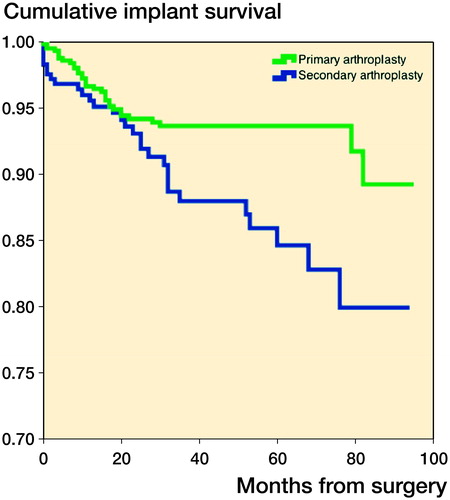
Figure 3. Implant survival functions of primary arthroplasty (green) and arthroplasty after failed locking plates (blue).
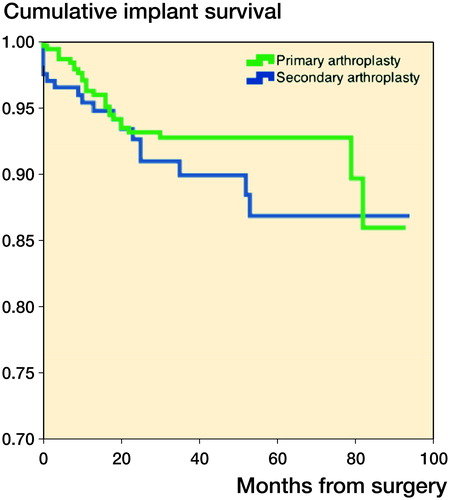
Table 4. Mode of failure of locking plates and outcome