
Figures & data
Figure 1. Control screen of the FluoroSim software running with the calibration femur. The software locates the colored markers and finds their center. It marks the position of the guide-wire on the camera image and, using the ATM, overlays this onto the pre-loaded radiograph. Both AP and CTL images are produced.
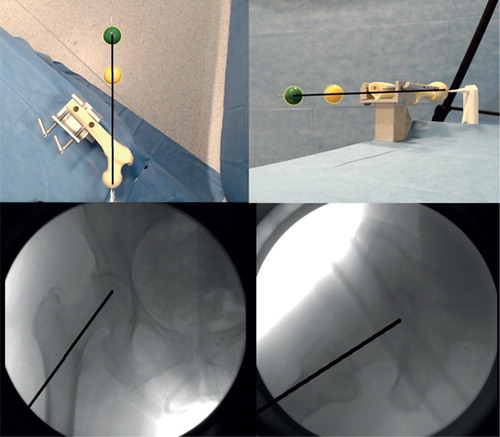
Figure 2. A right phantom limb produced out of a mannequin leg with an interchangeable workshop femur. In the background of the image the simulated radiograph of this construct may be seen.
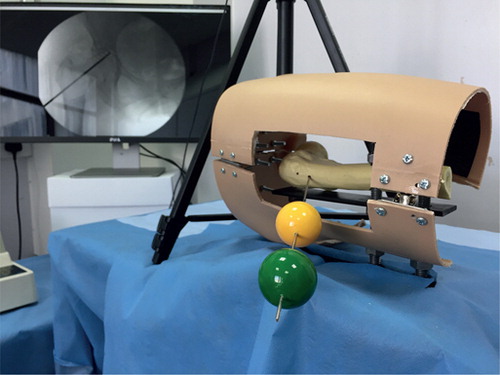
Figure 3. A surgeon using FluoroSim with the phantom limb, surgical equipment and the imaging system.
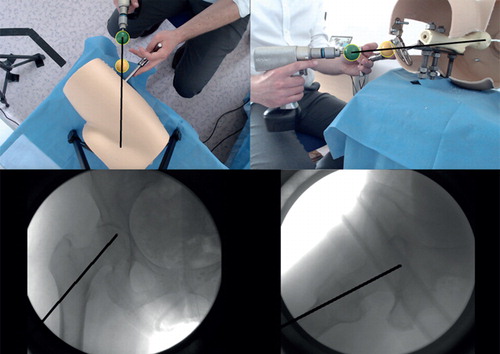
Table 1. Checklist used to standardize the participants’ instructions
Figure 4. A series of box plots for each objective metric. The central line represents the median, the boundaries of the box represents the upper and lower quartiles respectively, and the whiskers represent the range without outliers. A significance value is presented from the adjusted Mann–Whitney U comparison.
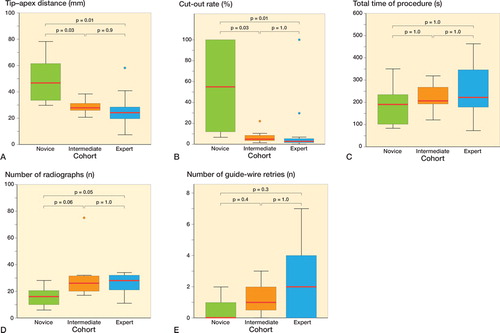
Table 2. Median performance of each cohort
Table 3. Percentage difference and (p-value) between the 3 cohorts for each objective metric a