
Figures & data
Figure 1. Directed acyclic graph depicting the potential associations underlying the effect of the main exposures on the outcomes.
U: unmeasured dietary habits and sedentary lifestyle factors.
Exposure: diabetes mellitus or HbA1c status.
Outcome: patient reported, clinical or complication outcomes.
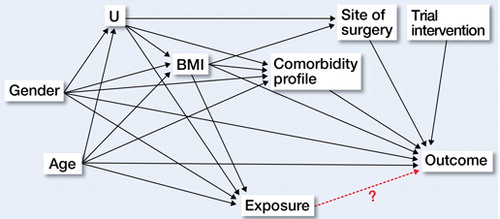
Table 2. Sample characteristics by diabetic status at preoperative assessment. Values are number (percentage) unless otherwise stated
Supplemental material