Figures & data
Figure 1. Flowchart of the patients included in this study (January 1, 1999–December 31, 2012).
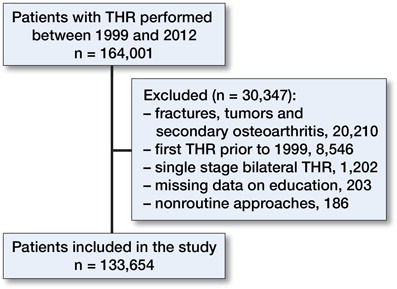
Figure 2. Multi-state analysis scheme and possible transitions. State 1 is the first hip replacement, state 2 is the second (contralateral) hip replacement, state 3 is the state where the first-performed hip is revised, whereas state 4 is the state where the contralateral hip is revised, and state 5 is death. The percentages stated are up to the 30- and 90-day mark as well as up to the 1-, 5-, and 10-year mark and represent the estimated transition probabilities within that given time.
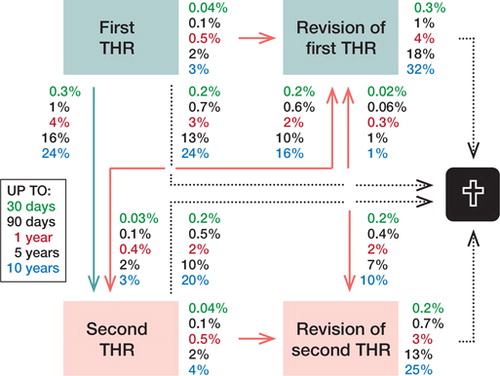
Table 1. Patient demographics of the cohort 1999–2012 (n = 133,654)
Figure 3. State occupation probabilities at different time points.
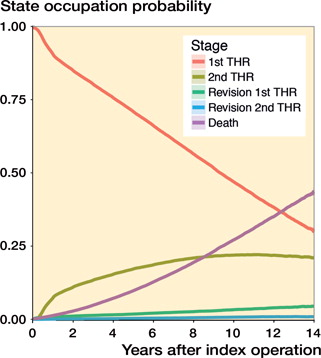
Table 2. Hazard ratios (95% confidence intervals) and the influence of different variables on the transition between different states a
Figure 4. Effect of sex (male versus female) on transition probability from the state of 1st THR to revision of the first hip or death within 1 and 10 years from the index operation at different ages, presented with CI. A: Effect of sex on revision probability within 1 year. B: Effect of sex on revision probability within 10 years. C: Effect of sex on death probability within 1 year. D: Effect of sex on death probability within 10 years.
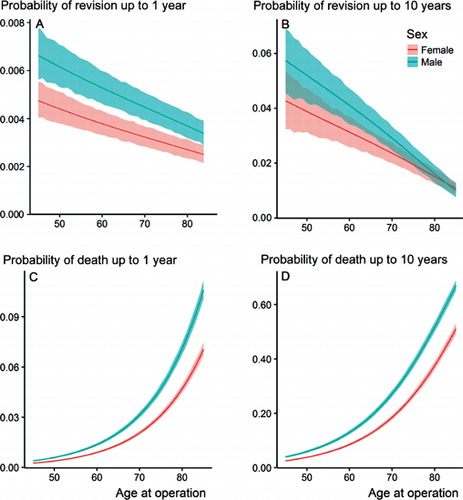
Figure 5. Effect of diagnosis (indication for surgery for the first hip) on transition probability from the state of 1st THR to revision of the first hip or death within 1 and 10 years from the index operation at different ages, presented with CI. A: Effect of diagnosis on revision probability within 1 year. B: Effect of diagnosis on revision probability within 10 years. C: Effect of diagnosis on death probability within 1 year. D: Effect of diagnosis on death probability within 10 years.
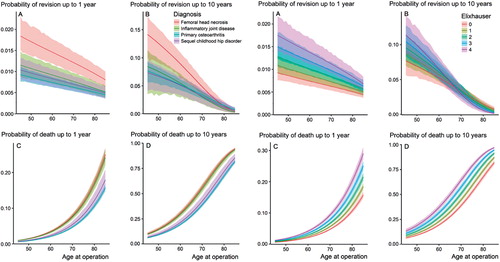
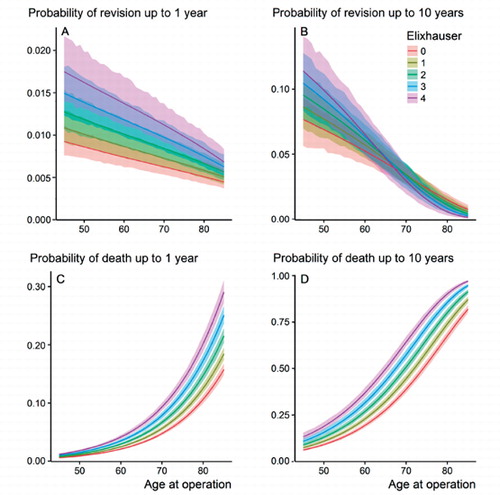
Figure 6 Effect of the Elixhauser Comorbidity Index (ECI) on transition probability from the sate of 1st THR to revision of the first hip or death within 1 and 10 years from the index operation at different ages, presented with CI. A: Effect of ECI on revision probability within 1 year. B: Effect of ECI on revision probability within 10 years. C: Effect of ECI on death probability within 1 year. D: Effect of ECI on death probability within 10 years.