Figures & data
Figure 1. Flowchart of data collection. Inclusion criteria are explained, and number of patients recruited and excluded are detailed.
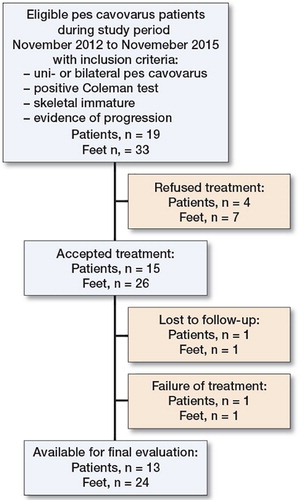
Figure 2. (Left) Preoperative picture of a 9-year-old child standing, seen from the back. The lines drawn show the presence of a heel varus deformity of the hindfoot. (Right) Same child in a similar position, 18 months after surgery. Note the changes in the heel position, now in a valgus position.
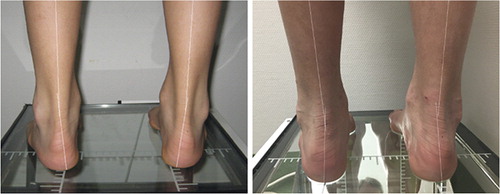
Figure 3. Radiographs of both feet taken preoperatively at 7 years 8 months (top), and postoperatively (bottom, same patient 18 months after surgery), to evaluate correction. On each radiograph the following angles were measured: on the AP standing view, the talus–1st metatarsal angle, and on the lateral standing view Meary’s angle and the calcaneal pitch. Note that the initial involvement was asymmetrical, with the right foot more involved than the left. By 18 months, both feet show signs of hypercorrection.
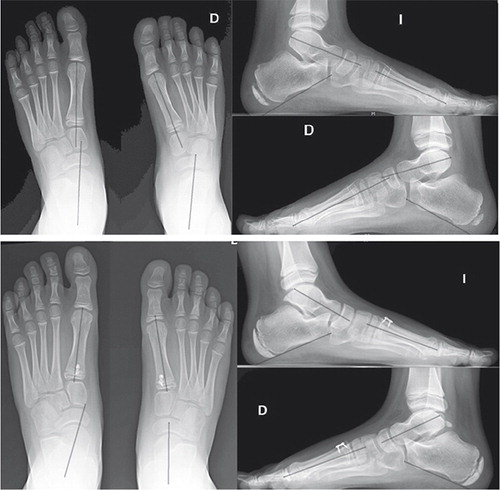
Figure 4. Operative pictures. A: Incision for the percutaneous plantar release. B: A dorsal incision for insertion of the plate is made; the physis is located with the help of a needle and confirmed under an image intensifier. C: detail of the inserted plate.
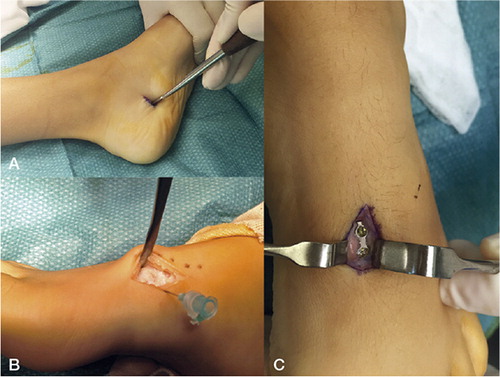
Figure 5. Box plot showing the evolution of the clinical varus deformity after the surgery. The heel angle is reflected at 2 different periods in time, preoperatively (blue) and at final follow-up (green). The results are show by side of foot involvement (please note that positive values in the heel angle line represents varus deformity at the heel, while negative values represent valgus). All the operated feet decreased their varus deformity. The red lines reflect the median heel angle for each group. The bottom of the box represents the 25th percentile and the upper the 75 percentile. The T lines extending from the boxes are the innerfences or whiskers and extend 1.5 the heigth of the box or if no case/row has a value in this range to the minimum and maximum values. The point represents an outlier.
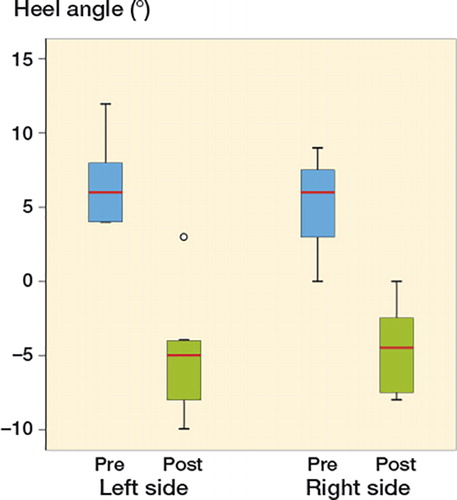
Table 1. Changes observed in the different radiologically measured angles preoperatively and at final follow-up
Table 2. Results of foot questionnaire: comparison between the different domains of the 7 patients who completed a questionnaire preoperatively and at final follow-up
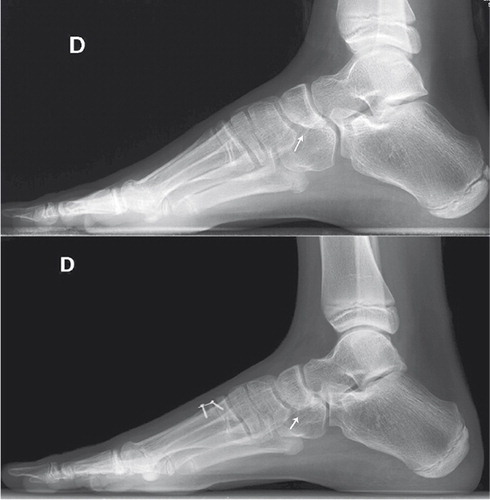
Figure 6. Despite the plate being located at the base of the 1st metatarsal, part of the correction occurs on the surrounding bones. The arrow points at the changes seen at the navicular bone in a patient 2 years after surgery. Note the enlargement of the navicular on its plantar aspect.