
Figures & data
Table 1. Review of all available incidence data on GCT-B
Figure 1. Diagram showing inclusion and exclusion of all patients with GCT in the Netherlands between 2009 and 2013.
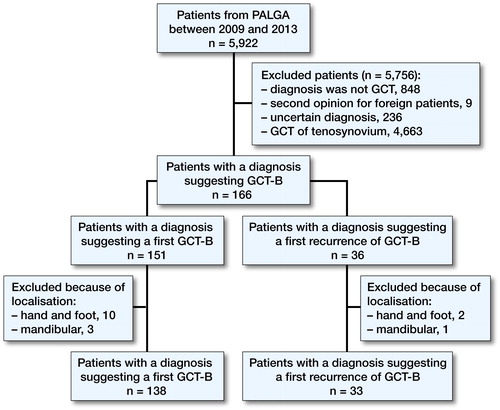
Figure 2. Crude incidence rates of GCT-B in the Netherlands with 95% confidence interval.
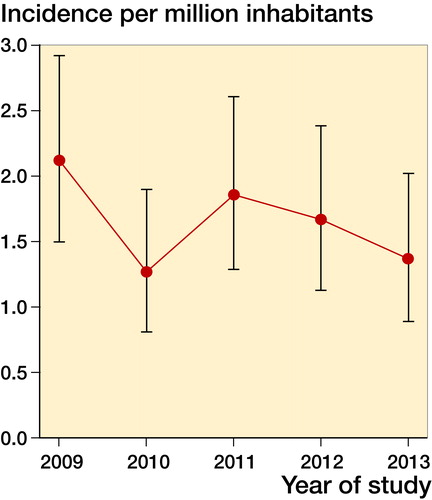
Figure 3. Age distribution of GCT-B in the Netherlands.
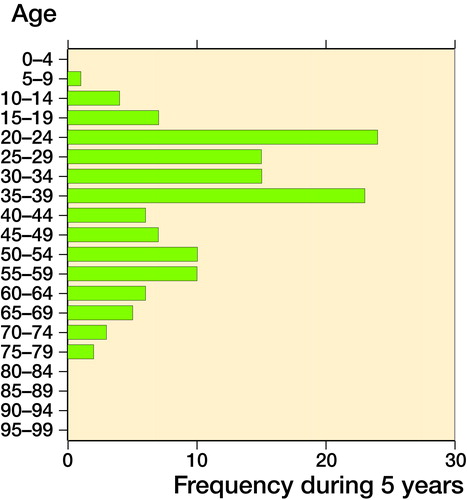
Table 2. Overview of incidence rates
Table 3. Frequencies of localizations of first GCT-B
Table 4. Localization of recurrences