
Figures & data
Figure 1. Snapshot of the IFINCTA tool showing the written information of the CTA on the left and the multimedia video clips and audio recordings on the right for the “approach” phase of the procedure.
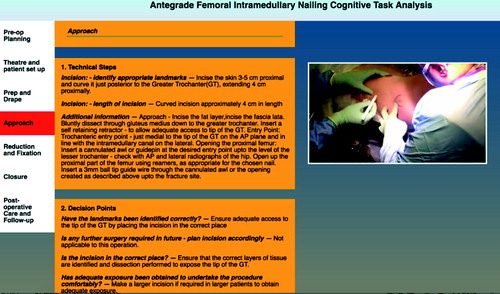
Figure 3. CONSORT diagram showing recruitment and follow-up of participants.
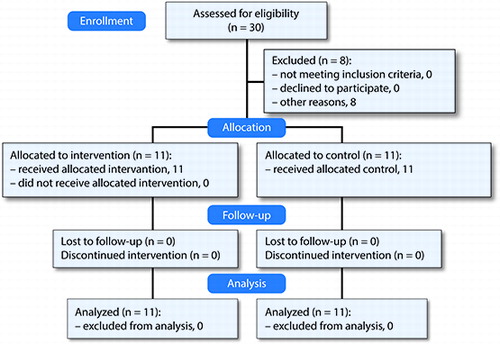
Table 1. IFINCTA tool rating parameters and rating analysis
Table 2. Comparison of pre-test “Touch Surgery™” assessment scores between intervention and control groups. Values are median scores (interquartile range)
Figure 4. Box and whisker plot comparing post-test “Touch SurgeryTM’ assessment scores between the IFINCTA and control groups for modules 1–4. Red lines are median values, boxes are interquartile ranges, whiskers are ranges of the data sets, and circles are 2 outliers.
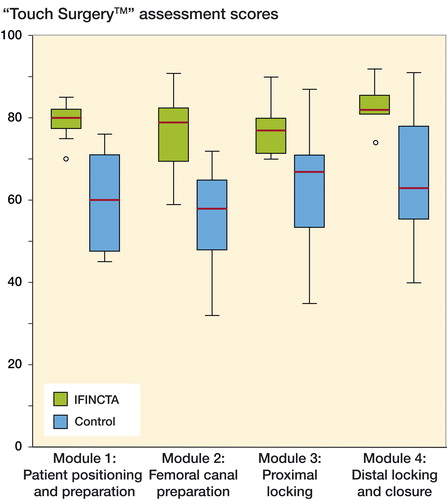
Table 3. Comparison of post-test “Touch Surgery™” assessment scores between intervention and control groups. Values are median scores (interquartile range)
Table 4. Comparison between pre-test and post-test scores for the intervention and the control groups. Values are difference between pre-test and post-test median scores