
Figures & data
Figure 1. The 4 knee-flexion and extension variables selected for the analysis (stance and swing phase in percentage of the gait cycle on the X-axis). 1: Knee flexion at initial contact (0% of the gait cycle) important for step length, which can be limited by hamstring spasticity and/or short hamstring muscles; 2: maximum knee flexion at loading response (0–40% of the gait cycle) manages force absorption; 3: minimum knee flexion in stance (25–75% of the gait cycle) describes degree of crouch; 4: and maximum knee flexion in swing (50–100% of the gait cycle) contributes to foot clearance.
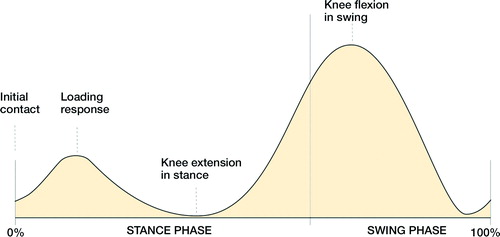
Figure 2. Procedures needed for the estimation of the knee flexion and extension angles with the 2-dimensional markerless video system: image pre-processing calibration (a), segmentation (b), participant-specific multi-segmental model (c), and joint-center tracking (d).
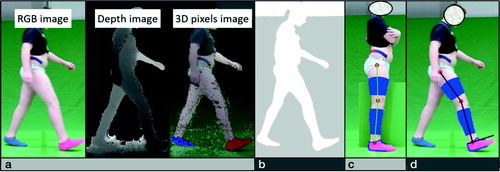
Figure 3. Bland–Altman plot for minimum knee flexion in stance on the left side (2D ML, 2-dimensional markerless; 3D GA, 3-dimensional gait analysis).
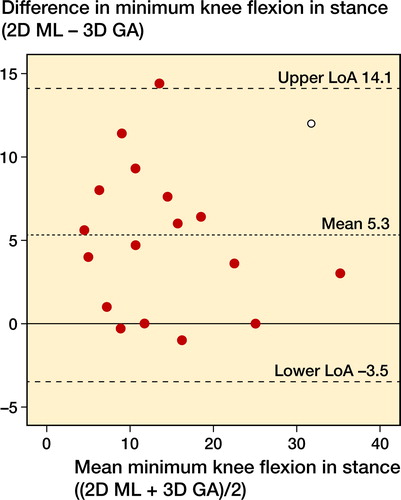
Figure 4. Bland–Altman plot for maximum knee flexion in swing on the left side (2D ML, 2-dimensional markerless 3D GA, 3-dimensional gait analysis).
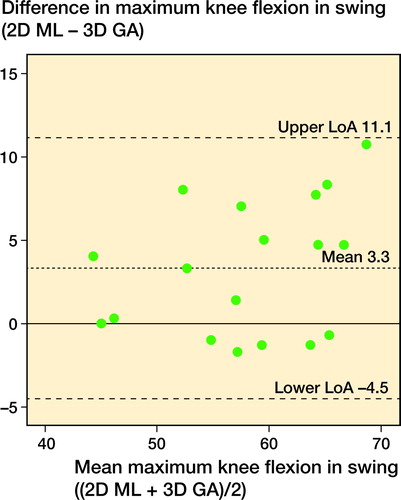
Table 1. Variables, side, and mean angles for the 2-dimensional markerless (2D ML) method and 3-dimensional gait analysis (3D GA)
Table 2. Comparison of estimates from the 2-dimensional markerless (2D ML) method and 3-dimensional gait analysis (3D GA)