Figures & data
Figure 1. Flow chart of the patient inclusion process.
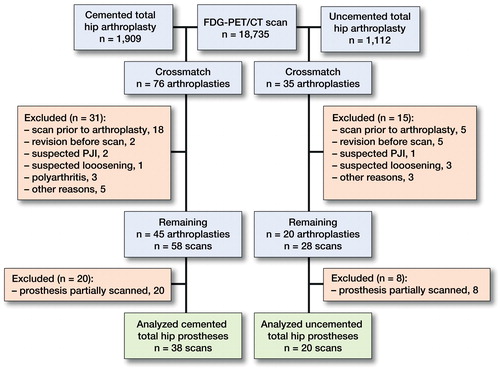
Figure 2. Example of 18F-FDG uptake in a non-infected total hip prosthesis. (A) Coronal FDG-PET image showing FDG uptake around the prosthesis, most prominent at the lateral side of the collum; (B, C, D) Coronal fused FDG-PET/CT images at different slices showing the uptake around the prosthesis; (E) Transaxial fused FDG-PET/CT image showing prominent physiological uptake at the lateral side of the cup of the prosthesis.
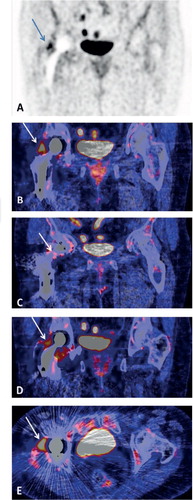
Table 1. Visual FDG-uptake pattern in non-infected hip prostheses
Table 2. SUVmax measured at 8 different locations around the prosthesis
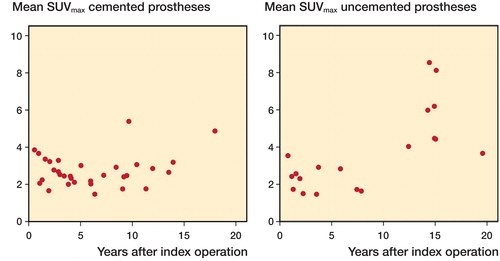
Figure 3. The relationship between the mean SUVmax and the age of the prosthesis in cemented (left panel) and uncemented hip prostheses (right panel).