Figures & data
Figure 1. Flowchart of the study process among 100 consecutive patients with symptomatic hip dysplasia scheduled for periacetabular osteotomy (PAO).
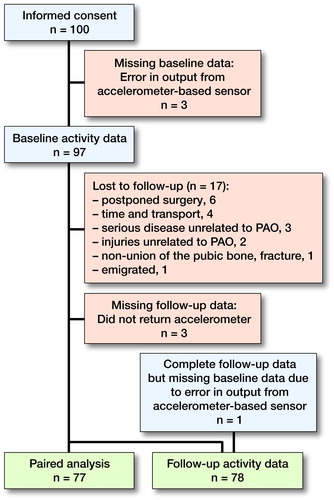
Table 1. Baseline characteristics of 97 consecutive patients with hip dysplasia
Table 2. Accelerometer-based physical activity and self-reported physical activity in hip dysplasia (n = 77)
Table 3. General physical activity profile based on objective data on patients with hip dysplasia
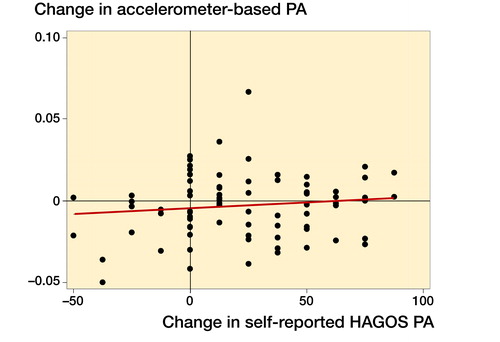
Figure 2. Scatter plot of the prediction of change in accelerometer-based physical activity (PA) at high intensity as a linear function of change in self-reported preferred physical activity participation (PA) measured by the Copenhagen Hip and Groin Outcome Score (HAGOS) from baseline to 1 year post-surgery.