
Figures & data
Figure 1. Inclusion and exclusion of patients in the study population. Patients with inverse hybrid fixation techniques were excluded from analyses as this method is rare and the registration is most likely due to error.
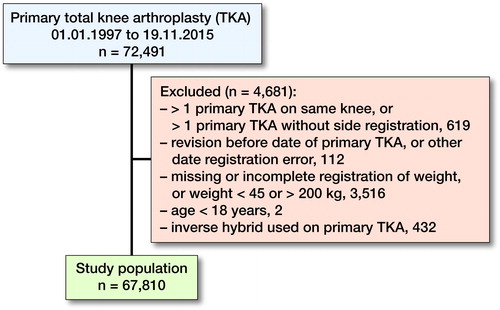
Table 1. Demography across weight groups
Figure 2. Cumulative all-cause incidence curves for revision of primary TKA according to weight groups.
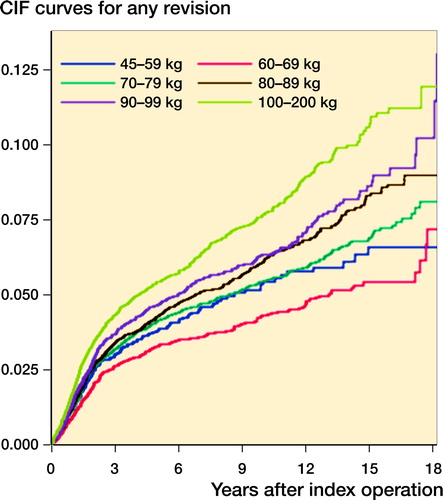
Table 2. Crude and adjusted hazard ratio (HR) with 95% confidence interval (CI) for revision (all causes) according to different weight and age groups. Values are number of subjects (95% CI)
Figure 3. Cumulative incidence curves for revision of primary TKA due to aseptic loosening for weight groups. For color codes, see Figure 2
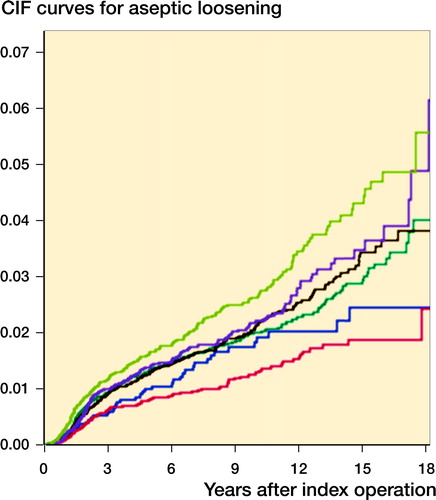
Table 3. Crude and adjusted hazard ratio (HR) with 95% confidence interval (CI) for revision due to aseptic loosening according to different weight and age groups. Values are number of subjects (95% CI)
Table 4. Crude and adjusted hazard ratio (HR) with 95% confidence interval (CI) for revision due to infection according to different weight and age groups. Values are number of subjects (95% CI)