Figures & data
Figure 1. Consort flow chart. All available data were used in the statistical analysis. A complete dataset was collected for 48 patients in the cemented group and for 23 patients in the cementless group. Demographic data at baseline were comparable between the 2 groups (). All patients were followed with RSA, conventional radiographs, and Oxford Knee Score over the 5-year follow-up period.
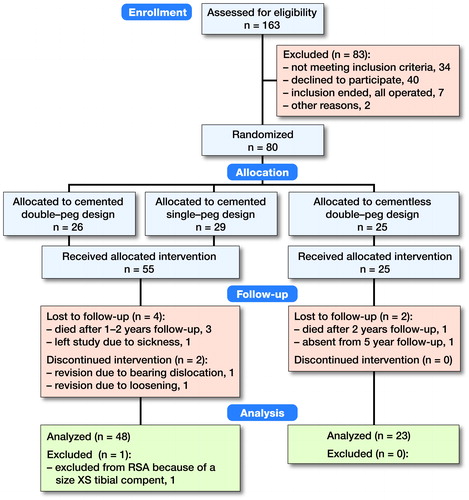
Table 1. Exclusion criteria
Table 2. Patient demographics at baseline
Table 3. Precision of minimal joint space width (mJSW) measurements and the femorotibial contact-point location
Figure 3. The frontal view to the left outlines the measurement of the minimal joint space width (mJSW). The dotted line represents the sagittal cross-sectional view presented to the right. The mJSW reflects the bearing thickness and the projected dotted line on the tibial component represents the femorotibial contact point. This allows the estimation of PE wear and the position of the bearing. Overhang is seen when the bearing exceeds the outline of the tibial plateau. Impingement can be identified if the bearing slides against the vertical wall (see frontal view).
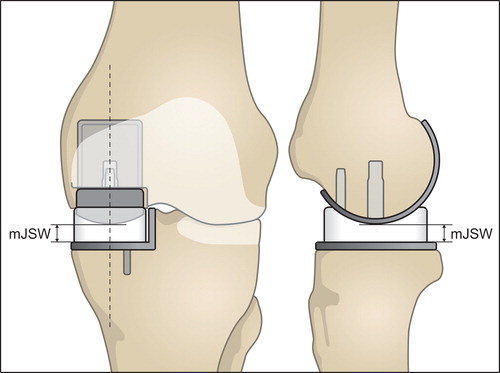
Figure 2. This figure outlines the set-up of the RSA examinations. To standardize the set-up, a rectangular foam support was applied between the leg and calibration-box. Patients were also asked to move their center of gravity over the operated leg to make sure that the prosthetic knee joint was loaded.
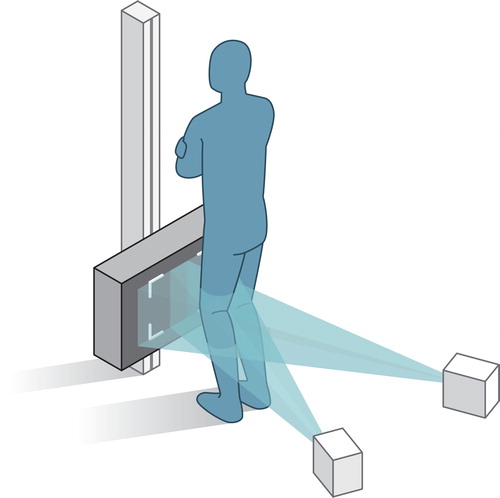
Table 4. Oxford Knee score. Values are mean (95% CI)
Figure 5. Distribution plots for the extent of bearing overhang. Medial overhang is shown to the left and posterior overhang is shown to the right.
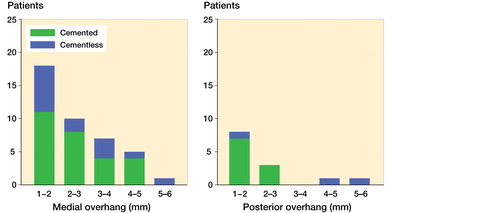
Figure 4. The linear wear-rate of the cemented and cementless Oxford UKA with 95% CI from the linear mixed model.
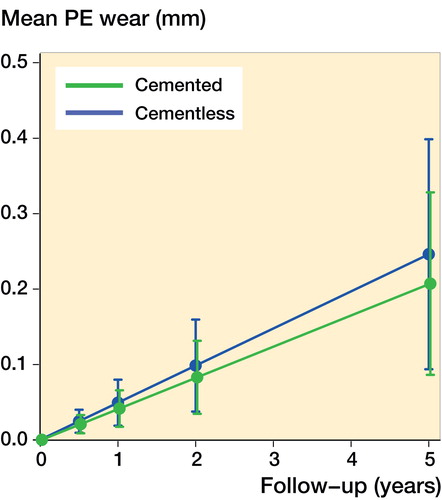
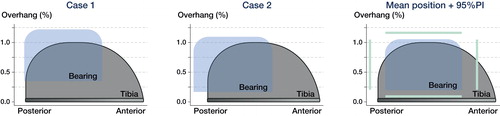
Figure 6. This figure visualizes a “top view” of the PE bearing and tibial component of the Oxford Medial UKA. The figures are based on the assumption that the bearing is kept parallel with respect to the vertical wall. Extreme cases of bearing overhang are visualized in Case 1 and 2. The mean bearing position for all patients with 95% prediction interval is visualized in the right panel. Case 1 represents the patient with 5 mm medial overhang and case 2 represents the patient with 5 mm posterior bearing overhang. The graphs are computed using the femorotibial contact point and the exact ratio between the size of the bearing and tibial component.