
Figures & data
Figure 1. Flowchart of study selection.
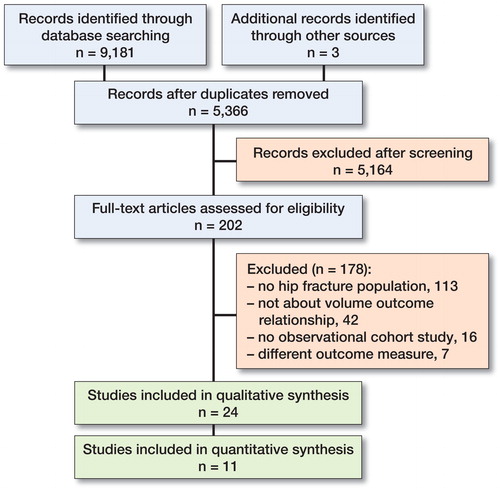
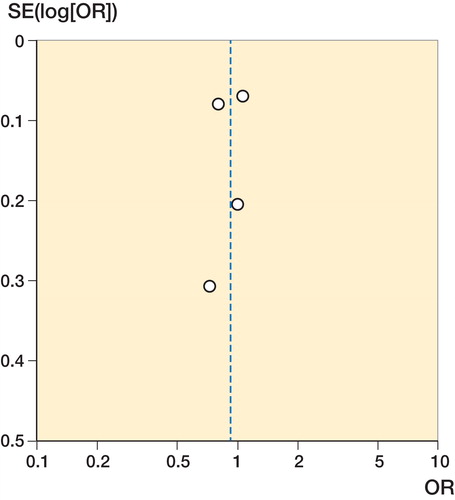
Figure 2. Funnel plot hospital volume.
SE = standard error.
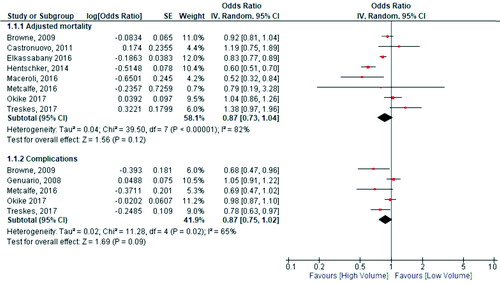
Figure 3. Funnel plot surgeon volume.
SE = standard error.
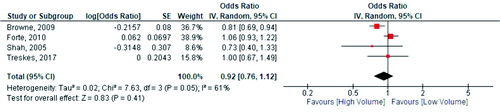
Figure 4. Comparisons of high- and low-volume hospitals. SE = standard error, df = degrees of freedom, and IV = inverse variance.
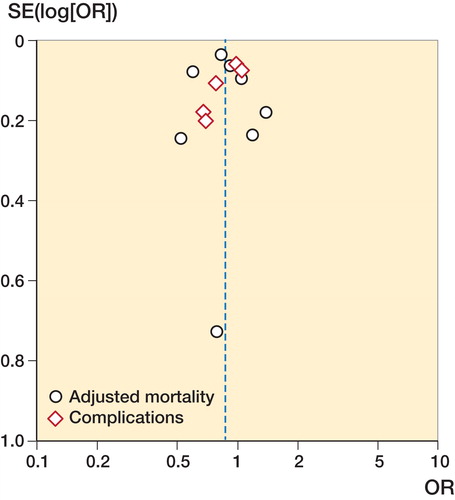
Figure 5. Comparisons of high- and low-volume surgeons. SE = standard error, df = degrees of freedom, and IV = inverse variance.
Supplemental material