
Figures & data
Figure 1. CONSORT flow diagram showing the inclusion/exclusion process and follow-up until minimum 5 years
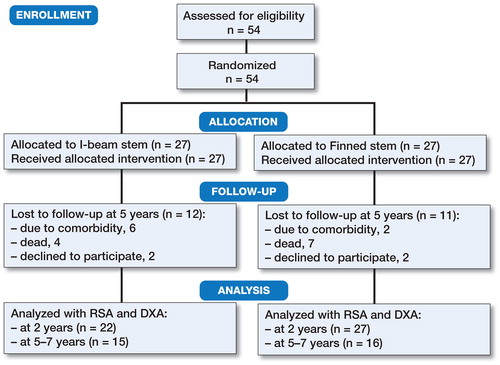
Table 1. Demographics, surgical and clinical data at baseline
Figure 2. The Maxim Total Knee (Zimmer Biomet, Warsaw, Indiana) with cobalt-chromium Tibial Tray Interlok components with (A) an I-beam stem and (B) a finned stem.
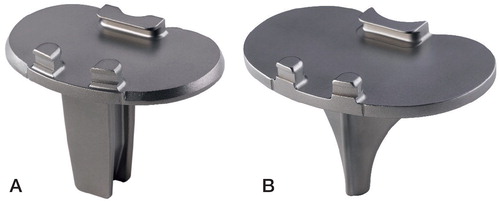
Figure 3. DXA scans showing the implant detection of the finned stemmed implant (blue), bone borders (yellow line), and 3 regions of interest (ROI) around the stem. A. Anterior/posterior view. B. Lateral view.
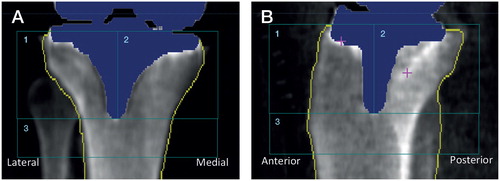
Figure 4. Line plot summarizing the MTPM, total rotation (TR), and rotation about the y-axis (internal–external rotation) of the tibial components in the 2 stem groups at 6 weeks, 3 months, 1 year, 2 years, and minimum 5 years. Between 2 and minimum 5 years’ follow-up there was a statistically significant difference in all 3 migration parameters showing higher migration in the tibial components with I-beam stem (red) compared with finned stem (blue). The dots mark the means and the error bars are standard deviations.
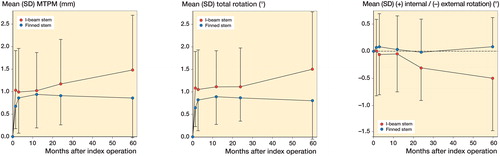
Table 3. Signed migrations of the tibial components at 1, 2, and minimum 5 years’ follow-up. Values are mean (95% CI)