
Figures & data
Figure 1. Flow chart. Of the 73,630 originally included patients, 70,981 remained for analysis. Standard stem length was 150 mm for both Exeter and Lubinus SPII.
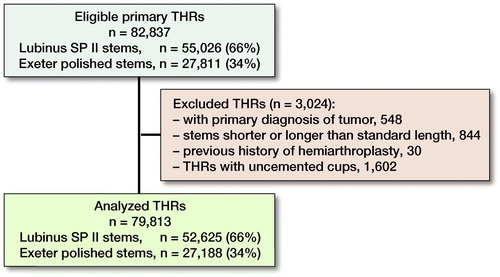
Table 1. Periprosthetic fractures (n = 31) primarily excluded
Table 6. Distribution of surgical approach among hips with primary OA. Values are frequency (%)
Table 2. Patient demographics and reoperations
Table 3. Type of cups (all cemented) used with Lubinus SPII and Exeter Polished stems. Values are frequency (%)
Figure 2. Cumulative survival (unadjusted) for periprosthetic femoral fracture. Numbers at risk at the end of 10 years’ follow-up were: 2,903 for the Lubinus SPII group, and 1,518 for the Exeter Polished group. 2(a): All fractures studied (Type B and C fractures). Mean survival at 10 years was 99.4% (SE 0.06) for the Lubinus SPII, and 97.9% (SE 0.17) for the Exeter Polished (log rank test p < 0.001). 2(b): Type B fractures. Mean survival at 10 years was 99.8% (SE 0.04) for the Lubinus SPII, and 98.6% (SE 0.11) for the Exeter Polished (log rank test p < 0.001). 2(c): Type C fractures. Mean survival at 10 years was 99.6% (SE 0.05) for the Lubinus SPII, and 99.3% (SE 0.11) for the Exeter Polished (log rank test p = 0.08).
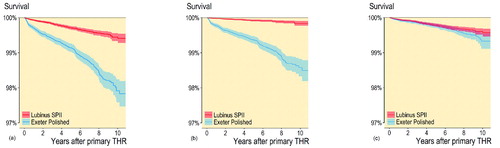
Table 4. Distribution of periprosthetic femoral fractures according to the Vancouver classification system. Values are frequency (%)
Table 5. Risk factors, adjusted hazard ratios (HR), and 95% confidence intervals (CI) for reoperation due to periprosthetic femoral fracture
Table 7. Risk factors, adjusted hazard ratios (HR), and 95% confidence intervals (CI) for reoperation due to Vancouver type B fracture