Figures & data
Figure 1. Flow diagram of included studies.
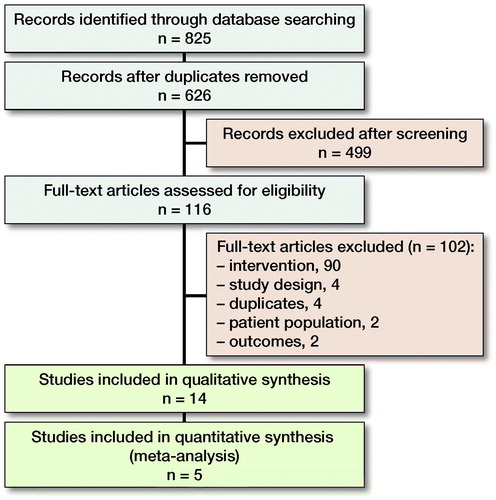
Table 1. Study characteristics. Characteristics are reported for intervention groups (patients receiving cefazolin i.v. only) unless otherwise reported
Table 2. Cefazolin dose and site of measurement of included studies
Figure 2. Risk of bias analysis, according to Newcastle–Ottawa Scale (NOS) (Wells et alCitation2013).
+: low risk of bias/good quality,
–: high risk of bias/poor quality,
?: unknown risk of bias/unclear or not applicable (e.g., comparability of cohorts in studies where only one group received intravenously administered cefazolin).
A green “+” matches with a star on the NOS.
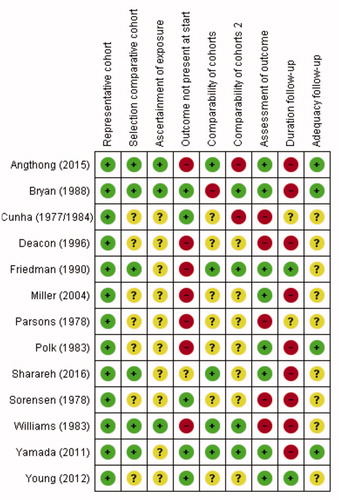
Table 3. Soft tissue target site cefazolin concentrations
Figure 3. Mean target site concentrations organized according to location of measurements. Mean or maximum target site concentrations of all included studies. When results were reported separately for individual patients or results were given for multiple time-points, these are depicted separately. The bar with the dotted line represents the reported MIC90 of Staphylococcus aureus (0.5–2.0 µg/L).
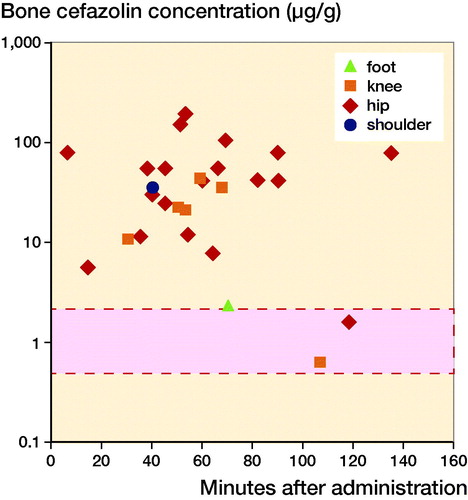
Table 4. Antibiotic concentrations organized by location of target site
Table 5. Antibiotic bone concentrations organized by dose
Figure 4. Mean target site concentrations organized according to dose of cefazolin. Mean or maximum target site concentrations of all included studies. When results were reported separately for individual patients or results were given for multiple time points, these are depicted separately. The bar with the dotted line represents the reported MIC90 of Staphylococcus aureus (0.5–2.0 µg/L).
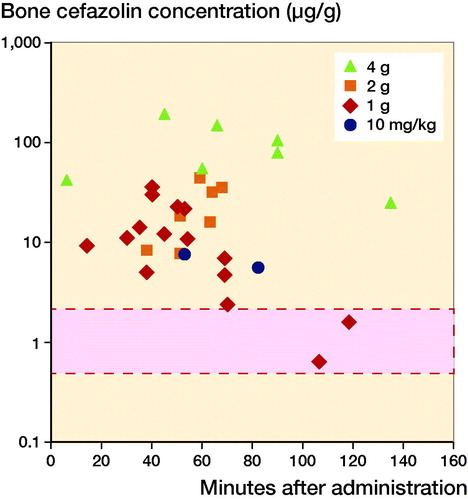
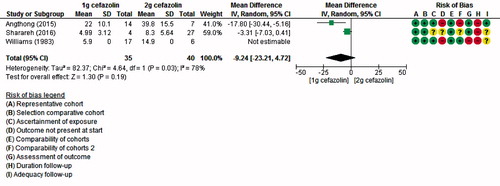
Figure 5. Pooled results: mean target site concentrations compared by location of measurement.
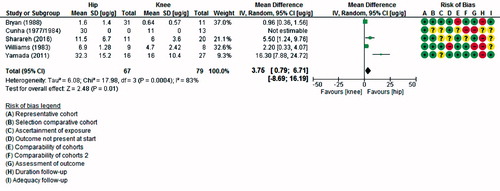
Figure 6. Pooled results: mean target site bone concentrations compared by dose. Due to the small number of studies for this outcome, no predictive interval was computed