
Figures & data
Table 1. Design features of different cemented stems (after Huiskes et al.Citation1998)
Table 2. Stem type and brand frequencies
Table 3. Comparison of taper-slip and composite beam stems
Table 4. Breakdown by stem type. Values are frequency (%) unless otherwise stated
Figure 1. Kaplan–Meier survival curve for taper-slip and composite beam stems. Taper-slip 97.9% (CI 97.8–98.0) and composite beam 97.6% (97.4–97.8) 8-year survival.
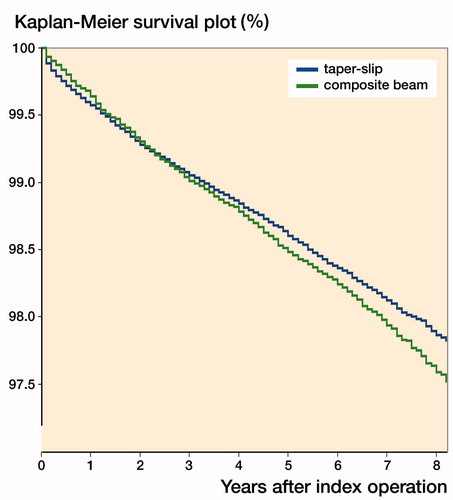
Table 5. Reasons for revision by stem type. Values are frequency (%) (multiple reasons allowable)
Figure 2. Kaplan–Meier survival curve for most implanted taper-slip, all other taper-slip, most implanted composite beam and all other composite stems. Exeter 97.9% (CI 97.8–98.0), all other taper-slip 97.6% (97.4–97.8), Charnley 97.5% (CI 97.2–97.8), and all other composite beam 97.7% (CI 97.4–98.0) 8-year survival.
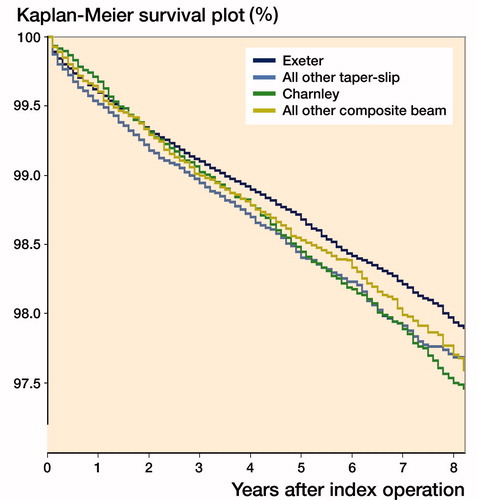
Table 6. Survival rates between groups
Figure 3. Plot of survival functions for each group when adjusted for confounders using Cox regression.
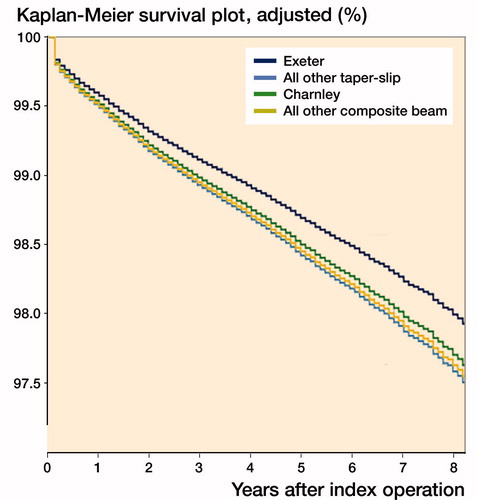
Table 7. Hazard ratios (HR), 95% confidence intervals, and significance levels for the Cox regression model, adjusted for known confounders. Only cases with no missing values included in the model