Figures & data
Figure 1. Patient selection.
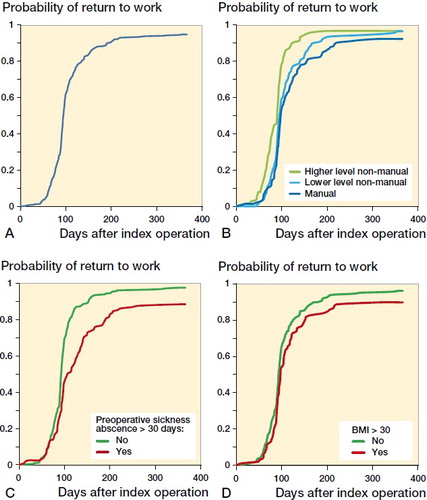
D
B
C
A
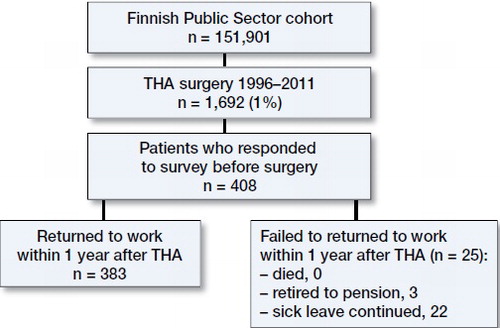
Figure 2. Probability of return to work overall (A), or according to occupational status (B), preoperative sickness absence (C), and obesity (D). The expected dispersion of survival curves between categories of these patient characteristics was observed across the entire follow-up period (log-rank test: p < 0.001 for occupational status and sickness absences, p = 0.01 for obesity).
Baseline characteristics of the patients and their associations with the rate of return to work after THA. Hazard ratios (HR) and their 95% confidence intervals (CI) are derived from Cox proportional hazard analyses. Schemper’s weighted Cox regression was used concerning occupational status, alcohol consumption and self-related health because proportional hazards assumption was not fulfilled