
Figures & data
Figure 1. Fracture patterns according to Letournel classification.
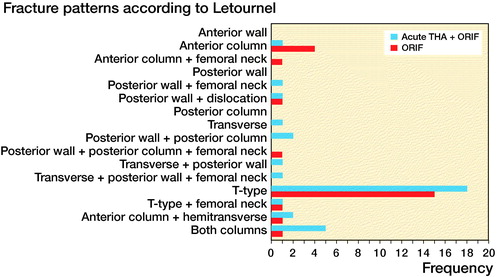
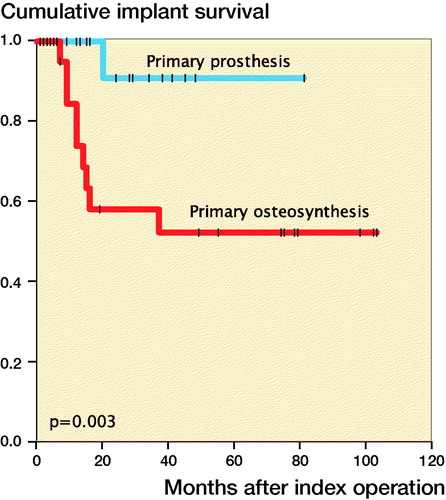
Table 1. Patient demographics. Values are mean (range) unless otherwise specified
Figure 4. Implant survival stratified by surgical group.
Table 2. Comparison of patients treated with acute THA + ORIF and those treated by ORIF alone followed by secondary THA due to posttraumatic OA. Values are median (range) unless otherwise specified
Supplemental material