Figures & data
Figure 1. Annual number of SHAs for acute proximal humeral fractures in Denmark from 2006 to 2015.
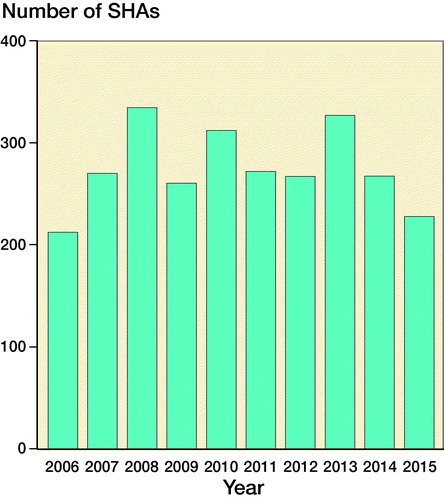
Table 1. Hierarchy of reasons for revision where more than one reason was reported
Table 2. Demographics, proportion of revisions, and mean WOOS score overall and for each age group
Figure 2. Distribution of WOOS scores. Red lines signify a WOOS score of 30 and 50.
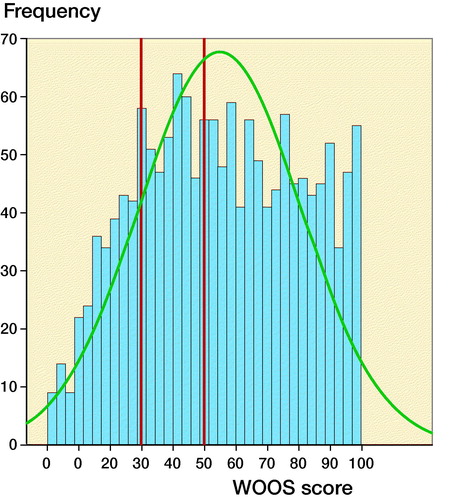
Table 3. Risk of revision. Cox regression modelTable Footnotea
Table 4. Reasons for revision. Values are frequency (percent)
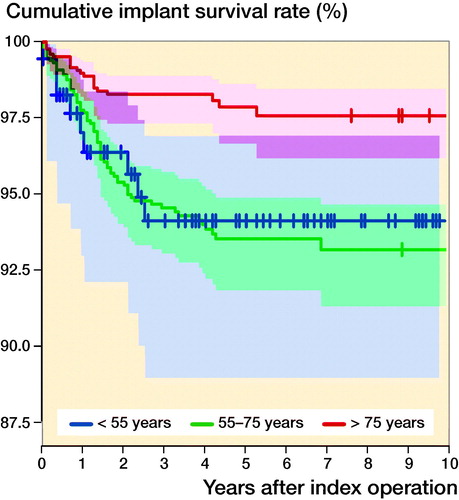
Figure 3. The 10-year cumulative implant survival rate and CI for patients younger than 55 years (blue), patients between 55 and 74 years (green), and patients older than 75 years (red) (p < 0.01).