Figures & data
Figure 1. A wrist radiograph was manually annotated with a red rectangle as the ground truth bound and automatically annotated with a blue rectangle as the candidate bound. The red rectangle and blue rectangle represent edges of the region of interest (ROI) detected by the orthopedists and edges of the ROI detected by Faster R-CNN, respectively.
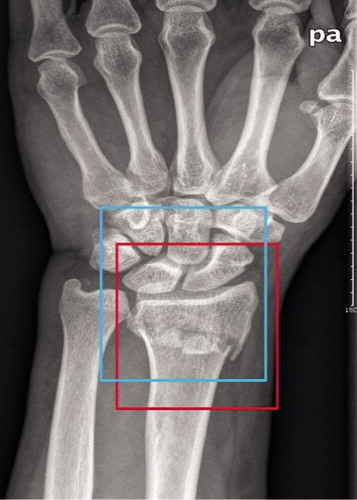
Figure 2. The formula with which the Intersection of the Union (IOU) was calculated.
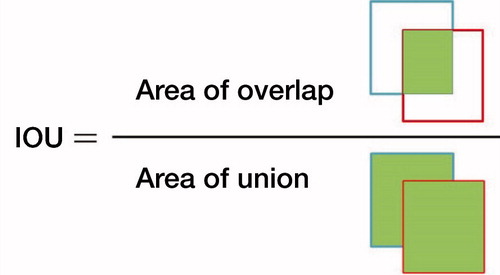
Figure 3. A typical example of the augmentation on 1 image from the annotated training dataset during the training course of Inception-v4.
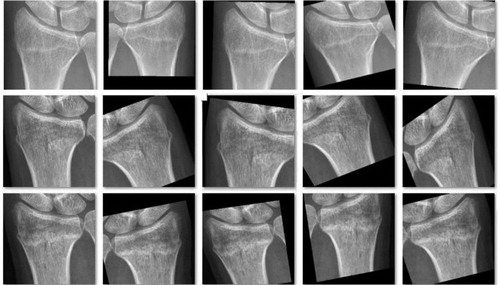
Figure 4. Flow diagram of the training and test courses of Faster R-CNN (shown in a green) and Inception-v4 (shown in a red).
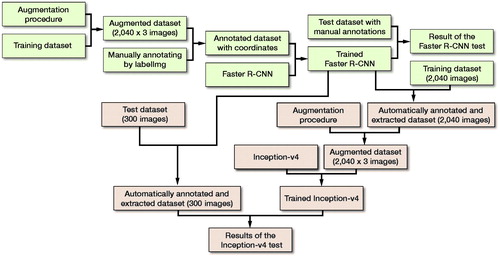
Table 1. Demographic data of the whole dataset with 2,340 patients enrolled in this study
Figure 5. The receiver operating characteristic (ROC) curve for the test output of the Inception-v4 model. The dots on the plot represent the sensitivity and 1-specificity of the human groups (the blue dot represents the orthopedists’ group; the red dot represents the radiologists’ group). The sensitivity/1-specificity dot of the radiologists’ group lies below the ROC curve of the Inception-v4 model, and the sensitivity/1-specificity dot of the orthopedists’ group lies above the ROC curve of the Inception-v4 model.
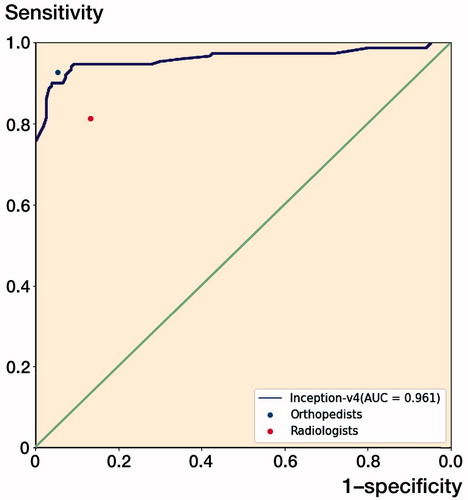
Table 3. Performance differences in the outcomes between Inception-v4 and each human group
Table 2. Diagnostic performance of the model and human groups
Figure 6. The same wrist with a DRF in the anterior–posterior view radiograph (a) and in the lateral view radiograph (b). The hidden DRF in the anterior–posterior view was apparent in the lateral view (the fracture is shown by the red arrow).
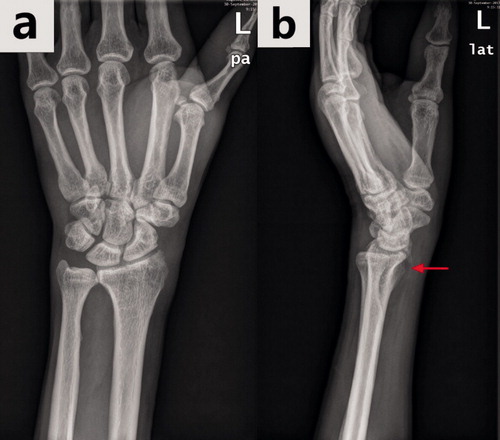
Figure 7. A typical example of the augmentation on 1 image from the training dataset during the training of Faster R-CNN (the top left image is the original one).
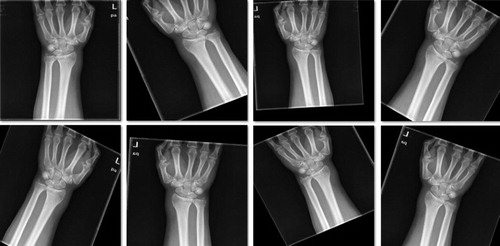
Figure 8. The training processes of Faster R-CNN with respect to the training sample in the training dataset and validation dataset. The mean square error (MSE) with value close to 0 indicates the accurate performance of the model.
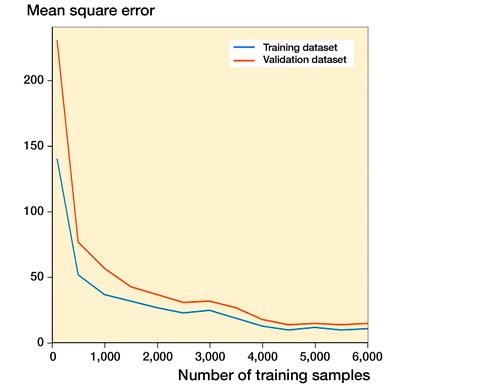
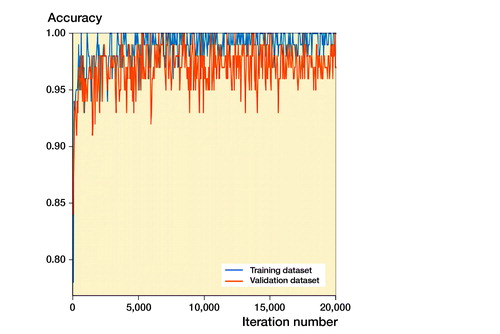
Figure 9. The training processes of Faster R-CNN with respect to the iteration number in the training dataset and validation dataset. The mean square error (MSE) with value close to 0 indicates the accurate performance of the model.
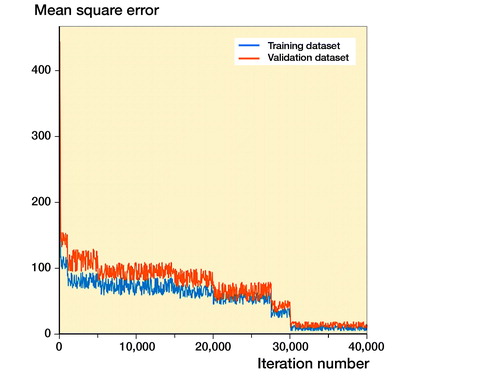
Figure 10. The training processes of the Inception-v4 model with respect to the training sample in the training dataset and validation dataset.
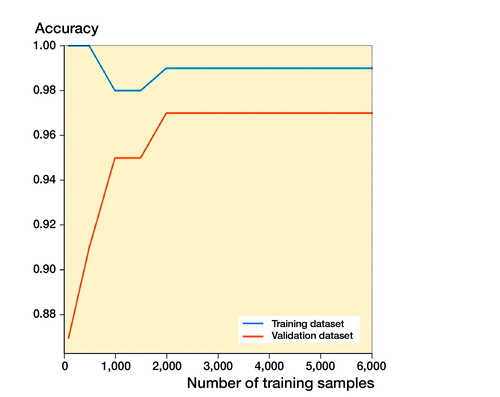
Figure 11. The training processes of the Inception-v4 model with respect to the iteration number in the training dataset and validation dataset.