Figures & data
Table 1. Acetabular cups included in the study
Table 3. Demographic data of the time period after data content revision in the Finnish Arthroplasty Register starting May 15, 2014. Values are frequency (%) unless stated otherwise
Table 4. Indication for revision prior to data content revision (May 15, 2014) of the Finnish Register. Values are frequency (%)
Table 5. Indication for revision after new indications for revision were added at the data content revision (May 15, 2014) of the Finnish Register. Values are frequency (%)
Figure 1. Kaplan–Meier survival for Continuum group and reference group with revision for any reason as the endpoint. 95% CI levels presented in blue and red.
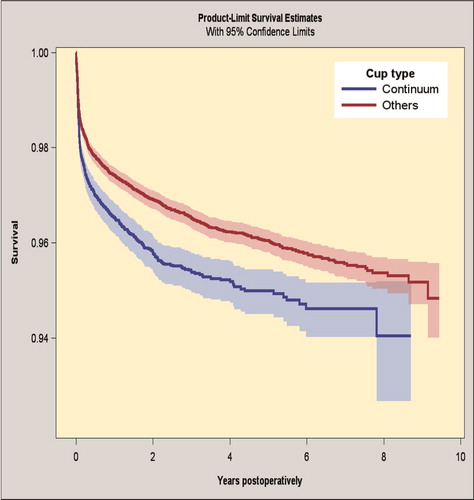
Figure 2. Kaplan–Meier survival for Continuum group and reference group with revision for infection as endpoint. 95% CI levels presented in blue and red.
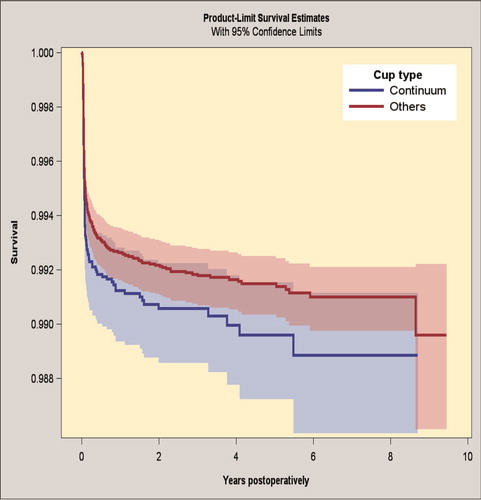
Figure 3. Kaplan–Meier survival for Continuum group and reference group with revision for dislocation as endpoint. 95% CI levels presented in blue and red.
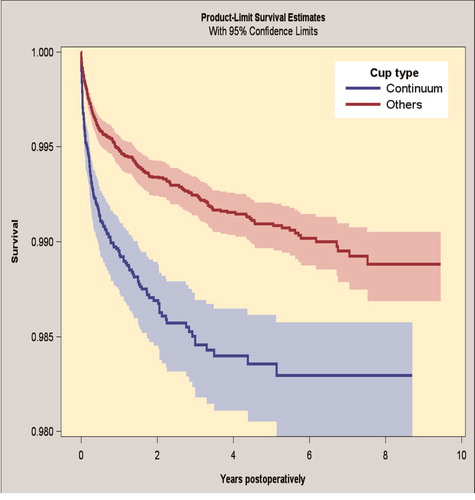
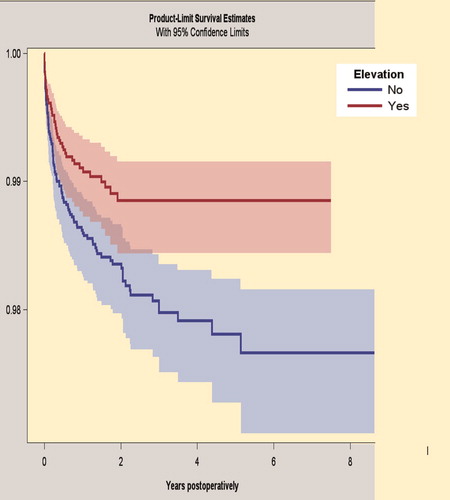
Figure 4. Kaplan–Meier survival by subgroup analysis of Continuum THA with or without elevated liner. Endpoint: revision for dislocations. 95% CI levels presented in blue and red.