
Figures & data
Figure 1. The flowchart describes the selection of patients. As defined here, excluded patients form 3 groups: missing 1, missing 2, and missing 3, further investigated in the missing data/non-respondent analysis (see Appendix). Abbreviations: THR = total hip replacement, OA = osteoarthritis, BMI = body mass index, ASA = American Association of Anesthesiologists’ classification.
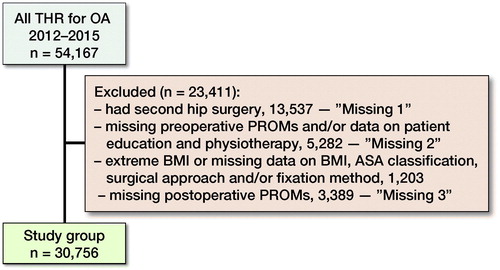
Figure 2. Linear regression results with the dependent variable pain VAS 1 year postoperatively.
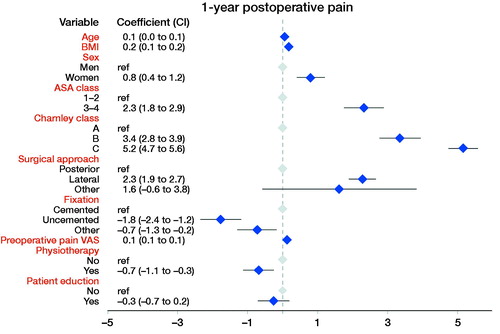
Figure 3. Linear regression results with the dependent variable EQ-5D 1 year postoperatively.
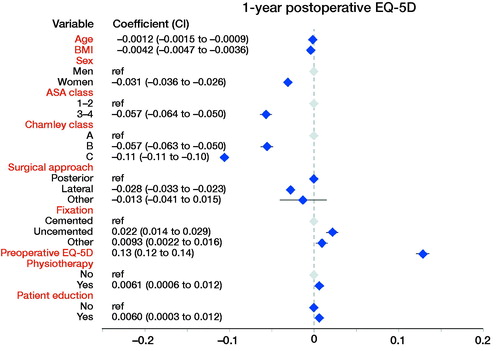
Figure 4. Linear regression results with the dependent variable EQ VAS 1 year postoperatively.
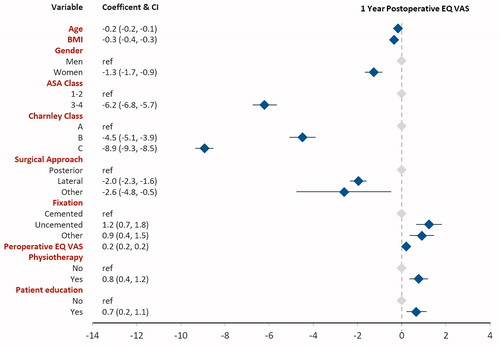
Figure 5. Linear regression results with the dependent variable satisfaction 1 year postoperatively.
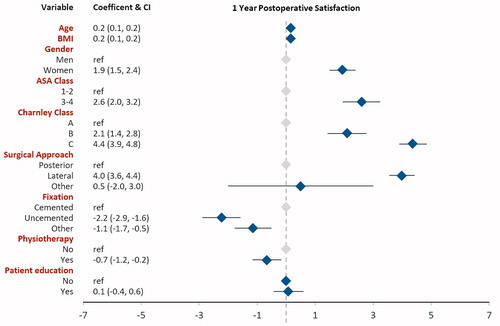
Table 1. Demographics