
Figures & data
Figure 1. RSA images showing the biplanar (lateral and anteroposterior) views with the polyethylene markers and tibial bone markers encircled in red, the fiducial markers in yellow, and the control markers in green. (a) Only 3 of 5 polyethylene markers are visible due to over-projection of 2 markers, in most cases, by the femoral component, which may reduce or invalidate the marker-based accuracy of the RSA measurement. However, migration can also be measured by fitting a model using the contours of the metal-backed tibial component as shown in orange. (b) Migration of the radiolucent all-polyethylene tibial component can only be measured with marker-based RSA.
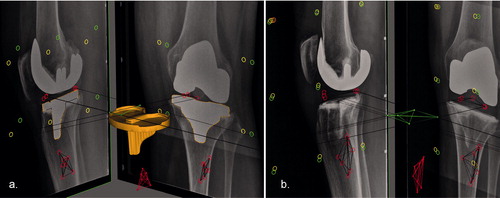
Figure 2. Lateral views showing the different reference origins (center of migrating model at reference time point T0) in (a) model-based and (b) marker-based RSA. The longitudinal axis is represented by the yellow line, the sagittal axis by the green line, and the red hexagon represents the origin. To fully compare model-based and marker-based RSA data using the same reference origin, a second model-based analysis was performed with the reference origin fixed in the center of the polyethylene markers as shown in b.
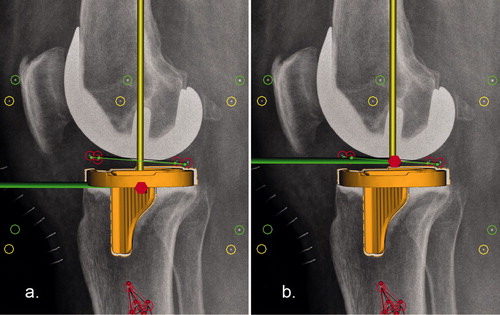
Table 1. Precision of RSA measurements (upper limits of the 95% CI around zero motion unless otherwise stated)
Figure 3. Scatter-plots showing (a) that marker-based transverse translation values are generally larger than model-based values due to the difference in position of the geometric center (which is either in the geometric center of the markers inserted in the polyethylene or in the geometric center of the model), also indicated (in b) by the proportional bias observed in the Bland–Altman plot (i.e., the difference between methods is proportional to the level of the measured variable) (Ludbrook Citation1997). (c) If model-based analysis is performed with the reference origin fixed at the geometric center of the polyethylene markers, results are nearly identical between methods, as also indicated (in d) by the absence of proportional bias and the small limits of agreement in the Bland–Altman plot. Solid lines in a and c: regression line. Dashed lines in a and c: line of equality. Solid horizontal lines in b and d: mean of differences. Dashed horizontal lines in b and d: 95% limits of agreement.
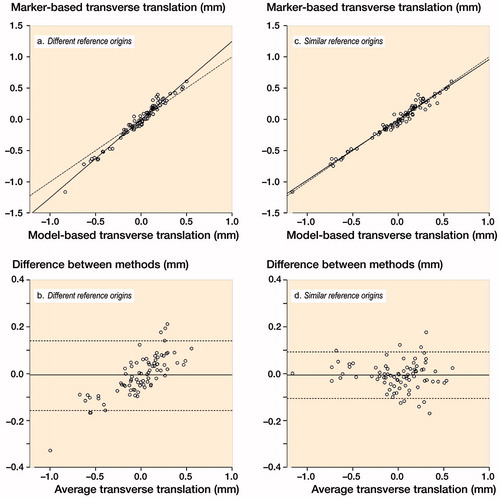
Table 2. Differences between marker-based and model-based translations and rotations with the reference origin fixed at the geometric center of the polyethylene markers
Figure 4. Box-and-whisker plots showing the polyethylene insert translations and rotations with respect to the metal tray at each follow-up (n = 28). The line in boxes indicate group median, the box the interquartile range (IQR); the whiskers the maximum values and outliers are depicted as circles (> 1.5 × IQR) and stars (> 3 × IQR). Shaded blue areas represent the 95% confidence intervals of zero motion (i.e., RSA precision, determined with double examinations), numbers of the outliers are patient study numbers.
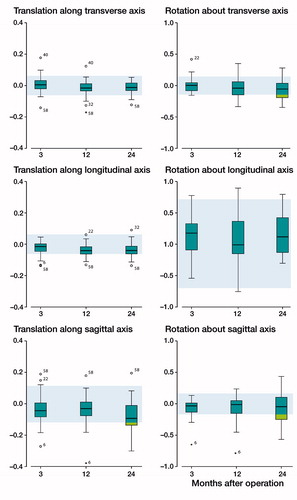
Figure 5. RSA analysis results of maximum total point motion (MTPM). The mean and 95% confidence interval for the metal-backed group is shown for both the marker-based (greeen line) as well as the model-based (blue line) analysis.
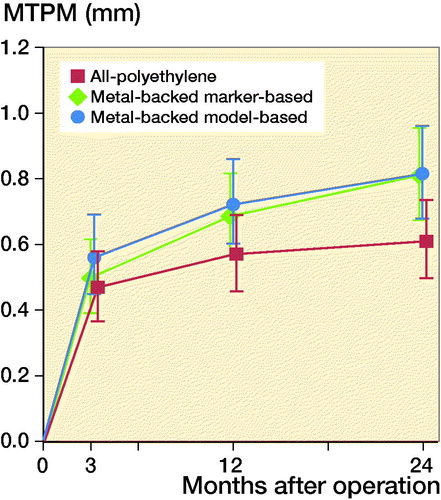
Table 3. RSA migration analysis of mean absolute translation and rotation along and about each orthogonal axis (log-values are back-transformed in the original scale)
Table 4. Adjusted RSA migration analysis of log-transformed maxi-mum total point motion (logMTPM)